
There are three tenants when buying a stock. Understanding the underlying fundamentals, macroeconomic forces and technical analysis for timing entries. We have covered off on the fundamental and macroeconomic parts through our research articles, top 5 best stocks to buy and top 5 high growth stocks to buy lists. This article will cover how to buy stocks using technical analysis to time your entries on the stock market to buy growth stocks.
Table of Contents
Step 1 – Market Context
Context is the first of the three technical analysis steps we take to picking a growth stock. Quite simply, stocks tend to rotate around a price area, which is what people perceive as fair value.
Stocks most of the time move in a pretty random manner. This is because investors and traders are buying and selling for their own reasons, none of which is easy to quantify.
When a stock trades at the top of a channel, this is called a resistance. The bottom of a channel is called the support.
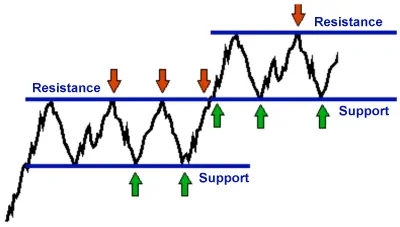
Support and resistance areas are important because these are areas where the stock either has to mean revert or break out. This tends to attract a lot of traders who are looking to capitalise on those who get the direction wrong.
Mean reversion happens when the stock fails to break out of resistance (red arrows) and trades back to its support area (green arrows). Statistically, this happens about 70% of the time. However, since channels are generally quite small, the average win-to-loss ratio is generally about 1:2.5, meaning that without an edge to pick a direction, you would come out about breakeven.
Breakout happens when the stock manages to break out of its channel, or resistance point, and trend higher. Statistically, this happens about 30% of the time. However, since breakouts can be quite strong, the average win-to loss-ratio can reach 3.5:1 depending on your exit criteria. This also means without an edge to pick a direction, you would come out about breakeven.
The aim of the game when timing growth stocks using technical analysis is to increase your breakout percentage to 50%, but keep or increase your 3.5:1 win-to-loss ratio.
Keep this in mind – buy high and sell even higher. As an investor looking for growth, the old adage of buying low and selling higher doesn’t work as well as buying a stock that already has momentum. Rather than look for a bargain, look for future growth. What looks high now, will look like an absolute bargain later. Amazon, when it was at $100 per share, looked expensive, but now that it’s trading at over $1,400 – does $100 still look expensive to you?
Principle number 1: Take notice of stocks that are at the resistance point, looking to break out, because trends can last for a LONG time. Buy high and sell even higher.
Step 2 – Volume Confirmation
Understanding volume and how it confirms a move is the second step to applying technical analysis to a stock. Volume is everything in the stock market because investor sentiment and activity is what drives stock movement. Fundamental analysts will scoff at the idea of looking at charts, but in the end, if nobody is buying your stock, your stock won’t go anywhere. Since volume is a true indicator of how much interest there is in a stock, volume is everything in the stock market.
If trade volume is elevated at a resistance point, this potentially means there is interest from investors who are willing to pay the top end of the range for stock, indicating a higher percentage chance the stock will break out of the channel. This is because professional investors who are trading the support and resistance channel, buy at the bottom of the range, and sell the top of the range. If they buy at the TOP of the range, it indicates they are expecting the stock to go higher.
Logically, this makes sense. Professional traders will not be willing to throw millions of dollars buying a stock at its highs unless they have a good idea from their analysis that it will go higher. Professional traders buy high at the top of the range to sell higher.

High volume in early May on a breakout indicated high institutional demand for TRIP, which led to a strong rally afterwards.
Principle number 2: If there is elevated volume at the top of a resistance point, then traders are expecting a breakout.
Step 3 – Price Action Confirmation
Volume on its own doesn’t tell us much, except that there is interest in the stock because we don’t know if the professional traders are the buy or sell volume. Price action as a final technical analysis step, however, can tell us what the supply and demand imbalance is and gives us clues as to what that volume and big traders are doing. If you are still using a line chart, now is the time to switch to candlestick charts. Here is a quick guide to the different candlesticks and how bullish or bearish they are:


If the price action is bullish and there is high volume, it means large buyers are using the opportunity to buy the stock. If the price action is bearish and there is high volume, it means large sellers are using the opportunity to sell the stock. Buying stocks when a stock is bullish and being on the right side of the trade will drastically increase your winning probability. It is that simple.
Principle number 3: If the stock is trading at resistance and there is high volume, the more bullish the price action, the higher the probability the stock will successfully break out. The more bearish the price action, the lower the probability it will break out.
What About Technical Indicators?
Indicators such as Moving Average, Bollinger Bands, Relative Strength Index (RSI), Stochastic Oscillator (STO) and Moving Average Convergence Divergence (MACD) are all just derivative indicators. They either derive from the share price (Moving Average, Bollinger Bands, MACD) or price action (RSI, STO) and does not add additional information. In fact, technical indicators such as this take away information by turning them into averages. These indicators are good as supplementary assistance to raw technical analysis (in fact, I use a moving average myself – just one though) but is useless and can be downright misleading used on their own or as a combination of indicators.
When trying to understand the markets, understanding supply and demand imbalance today is what’s important. This is why watching an uncluttered and raw chart will give you all the information you need. Unlike technical indicators which actually takes perfectly good data and removes information by averaging, by understanding context, volume and price action, you are accessing three completely independent data points that are up to date to the second.
Incidentally, this is why our Model Portfolios are named VPAC (Volume, Price Action & Context).
Key Takeaways When Using Technical Analysis On The Stock Market
The 3 golden rules when using technical analysis is to always trade when the context is right and the trade is confirmed by volume and price action. Forget technical indicators. Buy high and sell higher. If you want to become a consistent trader, using fundamental and macroeconomic analysis is not enough. Technical analysis and timing your entry on the stock market can mean the difference between a winning or losing trade.