
With the recent volatility in the markets and a major correction underway since the start of October, the end of the correction doesn’t look to be anywhere close to over. However, could we be seeing some temporary support at this level as the market becomes heavily oversold?
A number of indicators are indicating that the market is increasingly oversold with fear in the markets very overdone. If the US markets can capitulate and find some support at this level, we could see a strong rally into Christmas and perhaps into January. This will give world markets such as the Australian ASX 200 some much-needed relief.
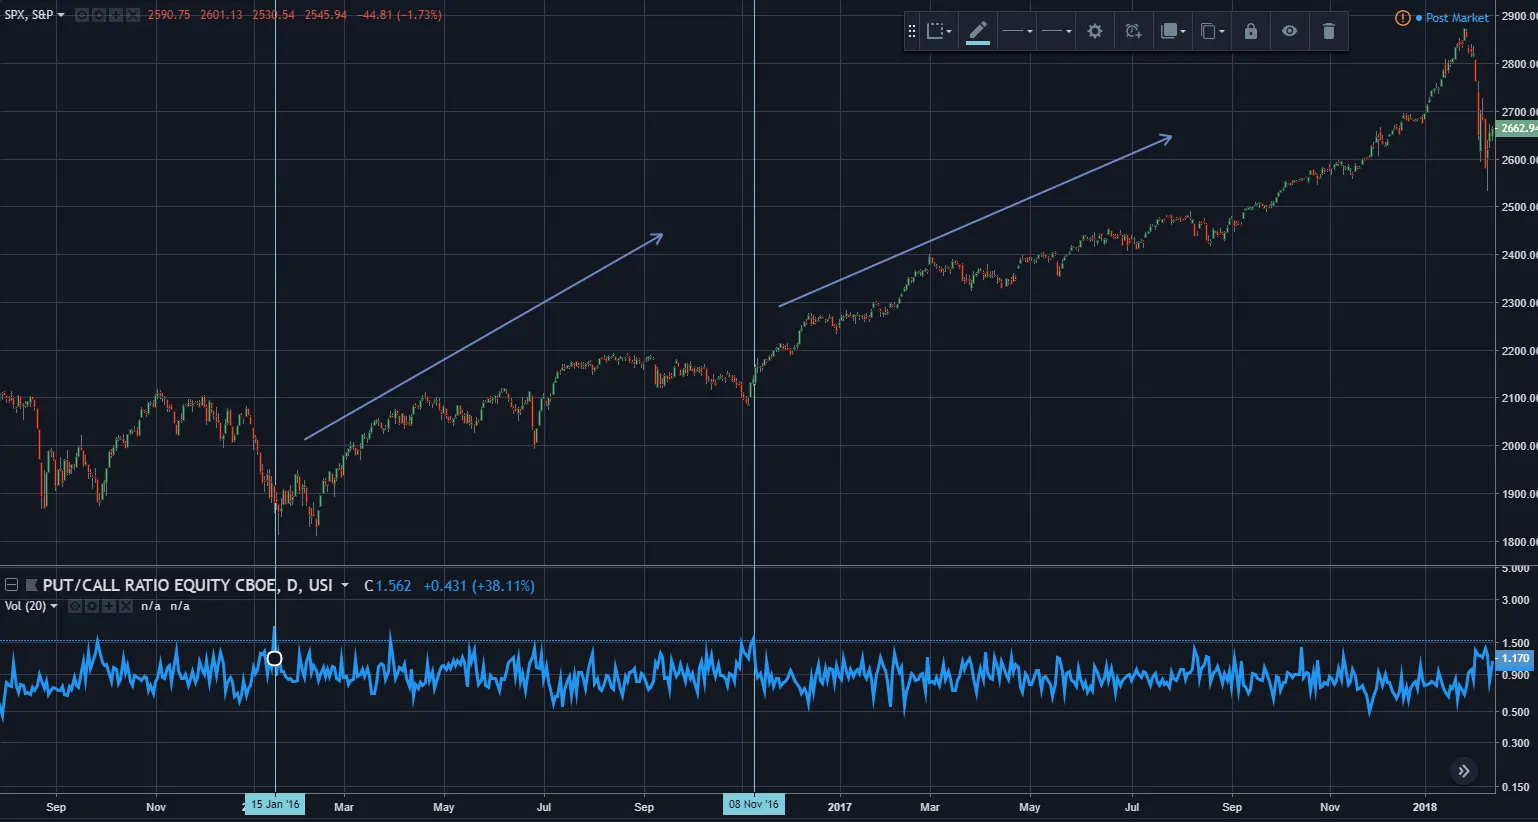
CBOE Equity Put/Call Ratio over 1.5x
The CBOE Equity Put/Call ratios are the highest (1.562) since 15th January 2016. The Put/Call ratio is considered a contrarian indicator as equity options are generally traded more heavily by retail investors and is a good indicator of fear in the markets. Generally when fear is at maximum and investors are buying a disproportionate number of puts, which it is now, the market tends to capitulate and reverse.

the US market made a full recovery and into a raging bull market from a low of 1812 in January 20th just 5 days later to a high of 2909 on 10th May 2018, up 60%.
The other time that the put/call ratio got this high (1.5+), was 8th November 2016, where the market then made a low of 2100 on the same day, before rallying to a high of 2909 on 10th May 2018, up 38%.
52-Week Lows at 119
The 52-week Lows on the S&P 500 is also running at extremes at 119. This indicator looks at how many stocks on the S&P 500 made new 52 week lows. Generally, when the indicator crosses down from more than 40 stocks making new lows to less than 40 stocks making new lows, the market has found a temporary bottom as the market capitulates from being strongly oversold.
As the indicator is now running at 119, which is exceedingly high, we can expect the market to find a temporary bottom in the next few days as the number of new lows drops back below 40.

Based on these indicators, there is a strong possibility that the US market has at least found a temporary bottom giving equities across the world some much-needed relief coming into Christmas and potentially into January.