
Today we’ll look at why we think Santos (ASX STO) is a good long term buy for your portfolio.
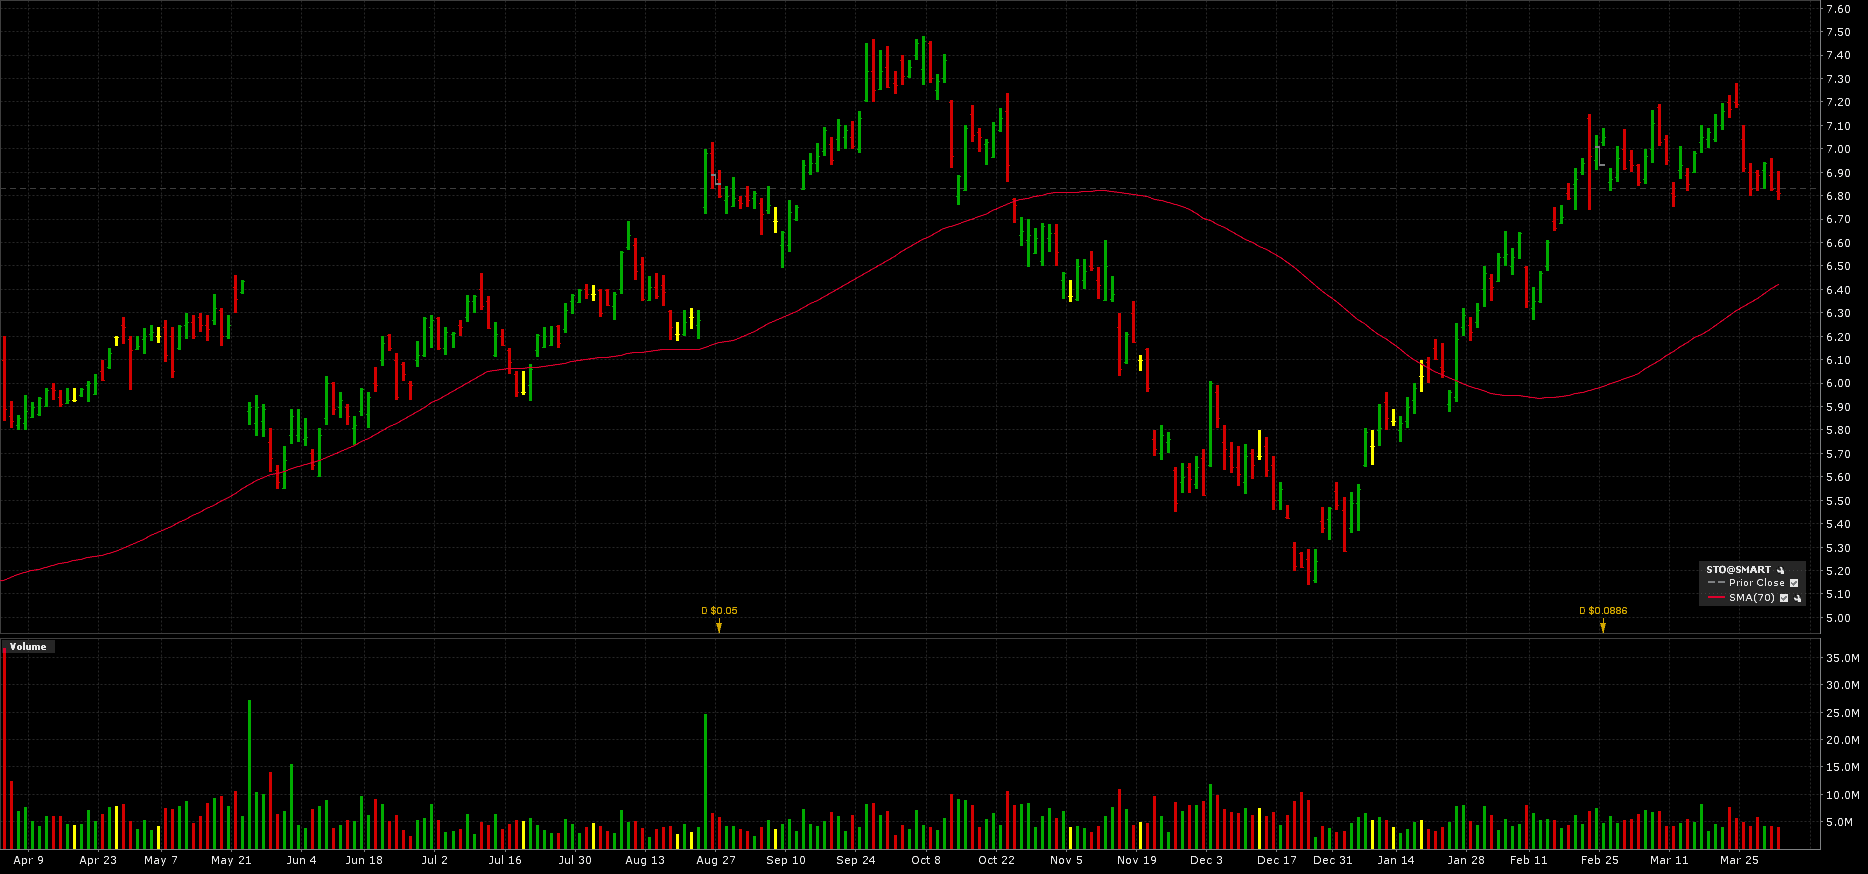
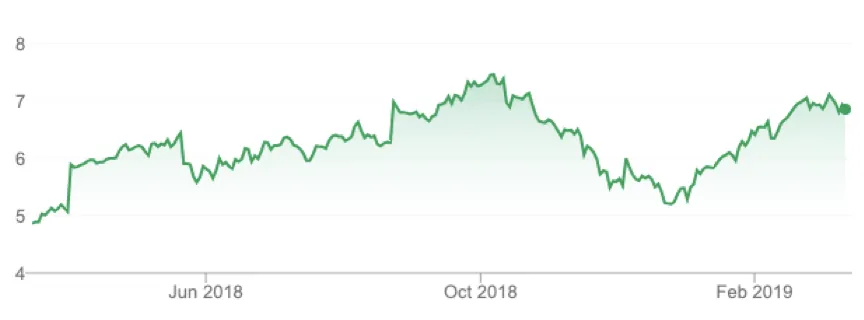
Since last year, Santos has rallied more than 17%, from around $5.80 to $6.80.
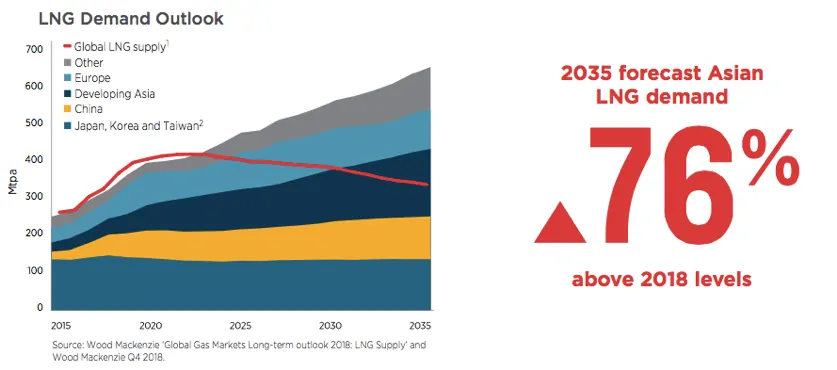
One of the major factors behind this is that the world demand for LNG is expected to outstrip supply by 2020s.
Santos, with 69% of its sales as Gas and LNG, is well positioned to take advantage of this.
So let’s get right into the research.
Table of Contents
About Santos (ASX STO)
Santos Limited (ASX STO) is the second largest independent oil and gas producer in Australia. Established in 1954, Santos has five major long-life natural gas and LNG assets. In FY18, Santo’s sales revenue increased 18% to US$3,660M, operating cash flow increased 26.4% to US$1578M and EPS increased from -17.3 to 30.2 cents.
Gas and LNG accounts for 69% of Santo’s sales. Santo’s market capitalization sits at AUD$15B, with current P/E at around 24 times.
Santos – 5-years Financial Performance Summary

Source: 2018 Santos Annual Report
Business Strategies
Santos’ diversified natural gas assets
Santos’ natural gas assets can be roughly divided into two geographic locations, West Coast Assets and East Coast Assets. West Coast mainly serves the domestic market and East Coast serves both the domestic market and the Asian market.
As illustrated in the map, West Coast Assets include those in West Australia and Northern Australia. while East Coast Assets include those in Cooper Basin, Papua New Guinea (PNG) and Gladstone LNG (GLNG) in Queensland.
STO-Five Core Assets Distribution
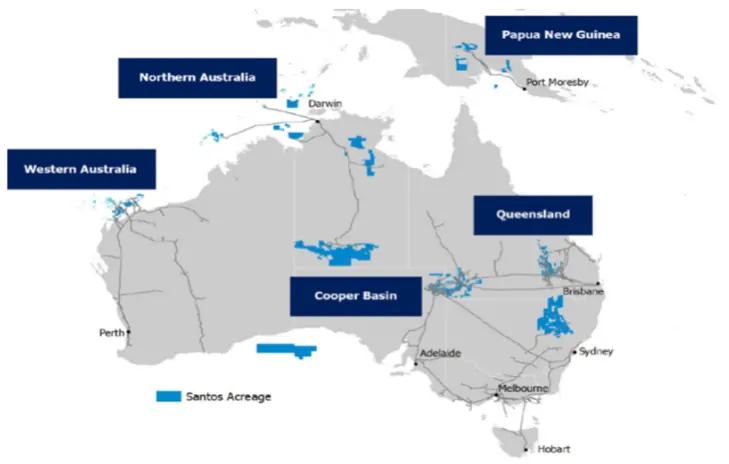
Source: Santos 2018 Climate Change Report
- Domestic demand from the West Coast. Due to the growth from mining and chemical manufacturing, the demand for natural gas on the west coast is estimated to increase to 100 PJ/annum by 2030. In FY18 Santos supplied over 120 Petajoules (PJ, per PJ equals to 19.6 million barrels of oil equivalent, MMBOE) of sales gas in the domestic market and 50 PJs of them serve west coast domestic market. Furthermore, two new gas sales contracts commenced in Western Australia in 2018 due to the acquisition of Quadrant Energy, providing revenue diversification and higher profit margin in West Coast Assets.
- Less shipping cost to Asian Market. Shipping cost from Australia and Papua New Guinea are 60% less than that from the Gulf of Mexico because it is geographically closer. Papua New Guinea LNG has been supplying LNG to four major long-term clients in Asia and Gladstone has been supplying two long-term Asian customers since October 2015.
Santos is moving back to local gas production
Before 2016, Santos invested in oil production in Asia, Indonesia and Vietnam. After 2016, Santos sold non-core assets in Asia, and focused on LNG, with expected production at 100mmboe in 2025.
- Santos claims to be the lowest-cost onshore gas developer. Santos develops the lowest cost onshore drill-complete-connect business. In 2017, free cash flow breakeven point reduced to $32 per barrel. Each core asset free cash flow is positive even during the time when the barrel of oil price is lower than $40. Unit of production costs reduced from US$ 14.14 to US$ 8.05/boe FY14-18.
- Santos exploration of new gas and oil. In the fourth quarter 2018 report, Santos released that the Cooper Basin exploration program found five new fields (four gas fields and one oil field) at Moomba South.
- Santos begins to pursue emissions reduction technology. In 2018, Santos announced a new program to convert over 200 oil well pumps in the Cooper Basin to run on solar power and batteries. Besides, Santos announced an appraisal program that intends to develop Australia’s first commercial-scale use of carbon capture, utilisation and storage (CCUS) for enhanced oil recovery and contribute to a reduction in CO2.
Business Opportunities
Global LNG demand will exceed supply in the early 2020s. The demand for LNG is predicted to increase at an annualised rate of 14.2% from FY18-22 and exceed supply in the early 2020s. As illustrated, global demand for LNG is expected to grow from 250Mtpa to around 700Mtpa 2015-2035.
The increase in demand is mostly driven by Asian countries, who plans to replace their coal-fired power plants by LNG to improve the air quality. Moreover, global LNG supply is projected to increase from 280 to 400 Mtpa FY15-20 but decline back to 300Mtpa FY20-30.
As illustrated, the gap between demand and supply of LNG would enlarge and is estimated to be 200 metric tonnes per annum (mtpa) by 2035.
China will become the largest gas importer. China and other developing Asian countries contribute significantly to LNG demand growth. China is forecasted to accounts for 37% of the growth in global demand in the next five years and it will become the world’s largest gas importer by 2019.
Moreover, gas demand in China is expected to increase by 60% by 2023 as the Chinese government is planning to use more of gas than coal in power plants to fight air pollution.
LNG is a cleaner energy source. LNG is becoming a more popular form of gas in terms of trading, whose market share is projected to increase from 30% to 40% FY17-23 (International Energy Agency, 2018).
As illustrated, natural gas is a solution to global warming, as LNG is 50% less emissions-intensive than coal, and 30% less emissive than oil.
STO-Carbon content for different fossil fuels
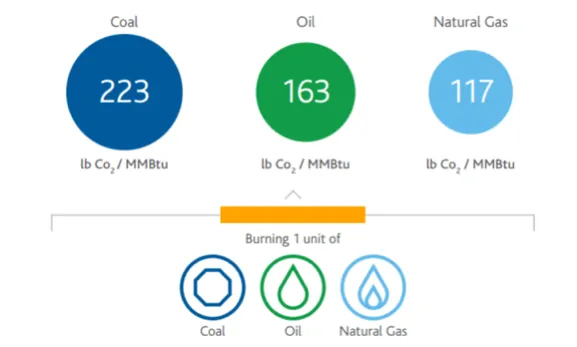
Source: Global Gas Report 2018
Business Risks
Extreme weather events affect Santos’ gas production. Santos’ onshore and offshore oil and gas production may be vulnerable to flooding and earthquakes. Production in 2018 was 1% lower than the previous year primarily due to the PNG earthquake (Santos, 2018).
Foreign currency risk. Santos’ sales are in US dollars but borrowings, operating and capital expenditure are mostly incurred in Australian dollars. Santos gained $134 million from foreign currency movement in FY17 but in FY18 Santos experienced a loss of 120 million from foreign currency loans after hedge.
Financial Performance and Peer Comparison
Financial Performance
High oil price assumption led to impairment loss. In the first half year of 2016 and 2017, Santos used a high oil price assumption to estimate oil and gas assets value.
However, the real oil price was much lower than expected, resulting in a large amount of impairment loss. These non-cash impacts are included in the net profit calculations, resulting in low basic EPS in 2016 and 2017.
Santos’ financial performance in 2018 is better off. Santos’ profit rose in 2018, especially in the second half of 2018 (2H2018).
Gross profit margin and net profit margin increased to 41% and 26.6% respectively in 2H2018. Revenue growth reached 17.86%. ROE increased significantly from 1.49% to 7.3%. Basic EPS increased by more than 300% from 7.02 to 25.25 cents.
STO – Half Year Financial Ratios Analysis 2016-2018
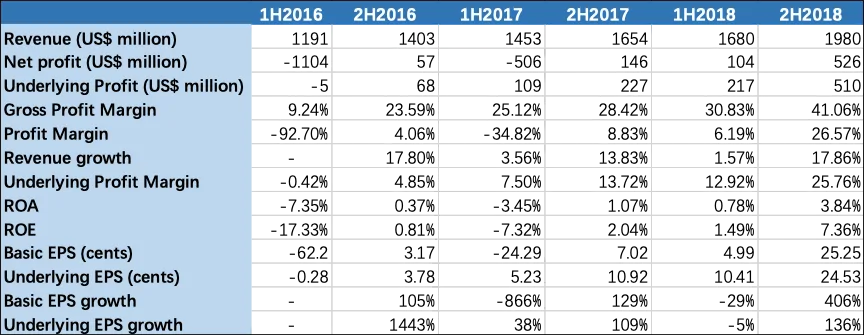
Note: Underlying profit excludes the impacts of uncertain foreign currency exchange and other events including asset acquisitions, disposals and impairments.
Peer Comparison
Peers are selected from Australian large gas producers. Selected competitors include Woodside (ASX WPL), Oil Search (ASX: OSH), Beach Energy (ASX: BPT) and Cooper Energy (ASX COE).
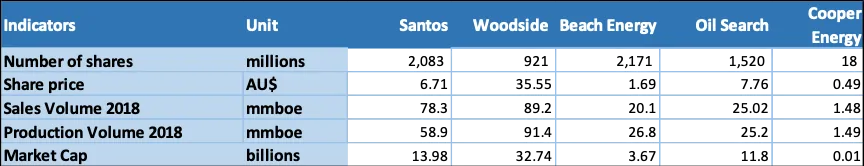
Santos is the second largest gas operator. Woodside is the largest gas producer at 91.4 mmboe. Santos comes the second, at 58.9 mmboe.
The production volume of Santos doubled that of Beach Energy (26.8 mmboe), followed by Oil Search (25.2 mmboe). The lowest production level is found in Cooper Energy, at 1.49 mmboe. In terms of market value, Woodside has the largest market value at $32.7 billion, and the market value of Santos is $13.98 billion followed by Oil Search at $ 11.8 billion.
Peer Comparison in Size
Peer Comparison in Profitability, Liquidity and Operation in 2018
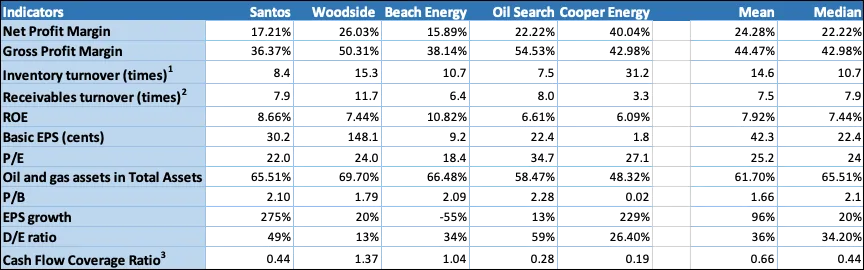
Notes:
- Inventory turnover = Cost of Sales/Average Inventories, represents how fast this company sells inventory. The higher the better.
- 2. Receivables turnover = Revenue/Average Receivables, indicates how quickly the company receive its sales from customers. The higher the better.
- Cash Flow Coverage Ratio = Operating Cash Flow/Net Debt, represents the ability of a company to pay interest and principal amounts when they become due. The higher the better. Over 1 means good financial health.
Lower P/E. Santos’ P/E ratio is 22, which is the second lowest one in the industry. Santos’ P/E ratio is lower than the industry average which is 25.2. In terms of P/E, Santos performs better than Woodside.
Great EPS growth. Santos experienced the highest EPS growth rate in 2018, which is 275%. EPS in 2018 increased by 300%. Santos’ EPS growth rate is much higher than the industry average, which is at 96%.
Higher ROE. Santos ranked the second in ROE, at 8.66%, which is higher than the mean 7.92% and median 7.44%.
Medium leverage level and Cash flow level. Santos’ D/E ratio (49%) is higher than the industry average (36%) but lower than Oil Search (59%). Cash flow from operation and cash flow coverage ratio of 0.44 is at the medium level of the industry
Medium liquidity. Santos’ receivables turnover, 7.9 times, is at the median level of industry. Santos’ inventory turnover (8.4) is lower than Woodside (15.3) but better than Oil Search (7.5).
Competitors offer more dividends. Santos plans to double its annual production to 100 mmboe by 2025, while Woodside Petroleum (ASX WPL) plans to achieve the same level by 2020, five years earlier than Santos. Woodside has a strong distribution to shareholders, with 148 cents dividend per share in 2018, while Santos only has 9.7 cents.
Moreover, Oil Search (ASX: OSH) only has as half production volume per year as Santos but it pays total dividends per share at 10.5 cents in 2018.
Santos has good upside potential in the long run
Santos Limited is an Australian energy producer focused on LNG. It has a relatively geographically diversified asset portfolio that serves both domestic and international market. Santos is the lowest-cost onshore gas developer in Australia and global gas demand is expected to exceed supply by 2020s. With the expected demand to rise, Santos is well positioned with strong upside in the long term.