

Sell
Fletcher Building makes building products, distributes construction materials and develops homes, with earnings tied to the New Zealand and Australian housing cycle.
Institutional sell-side research rates it Sell: FY27 EPS is forecast at NZ$0.18, below the NZ 26.5 cents the market implied at the result, a level only reached in FY29 at NZ$0.30. The FY26 beat leaned on a one-off provision benefit and demand pulled forward ahead of price rises, and no meaningful building market recovery is expected until calendar 2027. The company also pays no dividend while investors wait.
- Sell-side rating
- Sell
- Sell-side target
- A$3.10
- Upside to target
- +5.8%
- Initial price
- A$2.9318 Sep 2026
- Last close
- A$2.9318 Nov 2026
Fletcher Building is tracking well. Its FY26 result came in ahead of guidance, 13 of its 19 core business units lifted their returns, and its Distribution division swung back into profit. Some of the second-half volume was pulled forward from the year ahead, though, and at the time of the result the share price already assumed earnings well above what the company has delivered. Institutional sell-side research has Fletcher Building rated Sell with a 12 month price target of A$3.10, about 5.8 per cent above the share price of A$2.93 when this research was published. The research lifted the target 11 per cent after the result, and its Sell call rests on how much of the improvement the share price already includes.
Research published 18 September 2026. Price target and upside based on prices at time of publication.
Table of contents [hideshow]
About Fletcher Building
Fletcher Building manufactures building products, distributes construction materials and develops residential housing. Its key end markets are residential construction in New Zealand and Australia, which ties its earnings closely to the housing cycle on both sides of the Tasman and makes it a cyclical business. The group is organised around 19 core business units across manufacturing and distribution. Businesses named in its latest result include Winstone Aggregates, Humes, Iplex, Laminex Australia and a Distribution division that includes internal Frame & Truss production. The company is listed on the Australian Securities Exchange, reports in New Zealand dollars and has a June financial year end. It runs its balance sheet against a target net debt range of NZ$400m to NZ$900m, and management has been working through a programme of business improvement and simplification across the portfolio.
Ahead of Guidance Once Property Sales Are Stripped Out
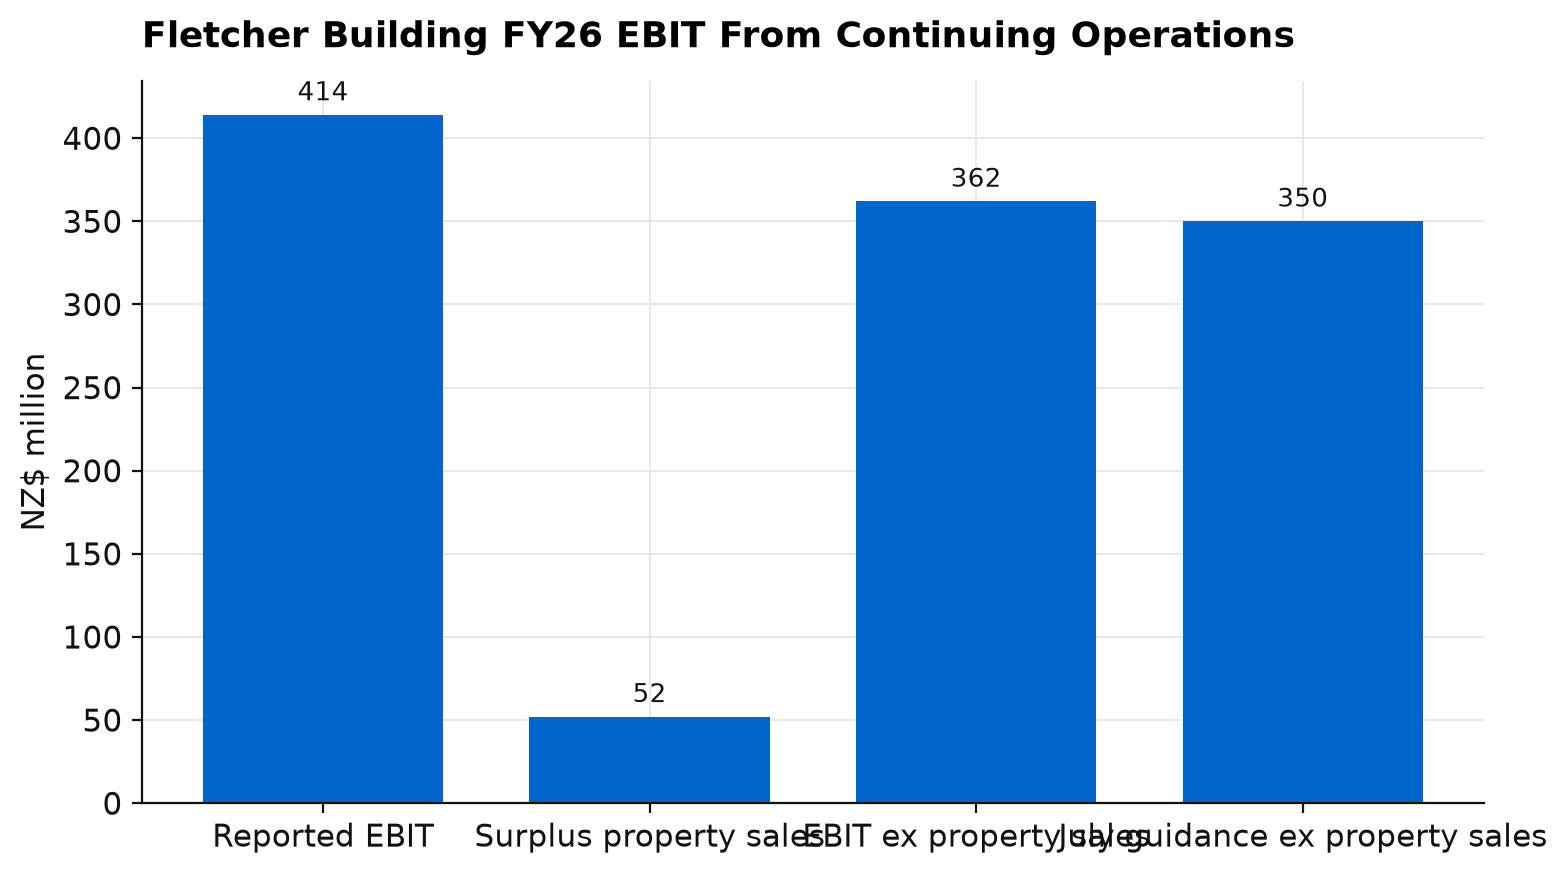
Fletcher Building reported NZ$414m of EBIT from continuing operations for FY26. EBIT stands for earnings before interest and tax, a measure of the profit the operating businesses generate before the cost of debt and the tax bill. Continuing operations means the businesses the company is keeping, with the parts it is exiting reported separately as discontinued operations.
That NZ$414m figure includes NZ$52m of surplus property sales, against just NZ$3m in FY25. Land and building sales are one-off gains that will not recur each year the way trading profit does, so a fairer read of the year leaves them out. Doing that leaves NZ$362m of EBIT from continuing operations excluding surplus property sales. That was about 4 per cent ahead of what institutional sell-side research had previously forecast.
It was also ahead of the company’s own forecasts. In July, Fletcher Building guided to FY26 EBIT of NZ$400m to NZ$403m, excluding discontinued operations and including about NZ$52m of earnings from property sales. That guidance implied roughly NZ$350m from continuing operations once property is excluded, against the NZ$362m delivered.
Part of the gap has an accounting explanation. Institutional sell-side research estimates a benefit of about NZ$12m relative to prior guidance from the finalisation of employee-related provisions. A provision is money a company sets aside in its accounts for a cost it expects to pay later, such as staff entitlements. When the final bill comes in lower than the amount set aside, the difference flows back into profit. That benefit largely explains the beat against both guidance and the prior forecasts, so underlying trading landed close to management’s July guidance.
Net debt, meaning borrowings less cash, ended the year at NZ$637m. That sits within the company’s target range of NZ$400m to NZ$900m, and slightly inside the lower half of it. The company declared no dividend.
Market Share and Better Execution Drove the Second Half
Excluding surplus property sales, EBIT from continuing operations grew about 8 per cent, and volume was the main driver. Management put the growth down to market share gains, with no broad recovery in building yet, and to customers bringing purchases forward into the second half of FY26 ahead of price increases.
This is known as pull-forward: buyers who know prices are about to rise order early, which lifts sales in the months before the increase and leaves a gap in the months after it, while the overall amount of building work stays the same.
Iplex was singled out as a beneficiary of that pull-forward, and its volume has already pulled back in the new financial year. That is the strongest sign that some of the second-half strength was borrowed from FY27. The pace at which FY26 finished is unlikely to carry straight into the first half of the new year.
Operations also improved across the core divisions. The Distribution division swung from a NZ$4m first-half loss to NZ$16m of EBIT, helped by stronger internal Frame & Truss production and lower unit costs. Winstone Aggregates and Humes both recovered volume. Laminex Australia expanded its margin, meaning it kept more profit from each dollar of sales. These improvements are within the company’s own control, and they should hold up better than gains that depend on when customers place orders.
A rules-based approach to leveraged ETFs
See how our quantitative strategy works and who it suits.
Explore the strategyBecome an authorised representative
Advise your clients under an established AFSL without building your own. Choose AR or CAR.
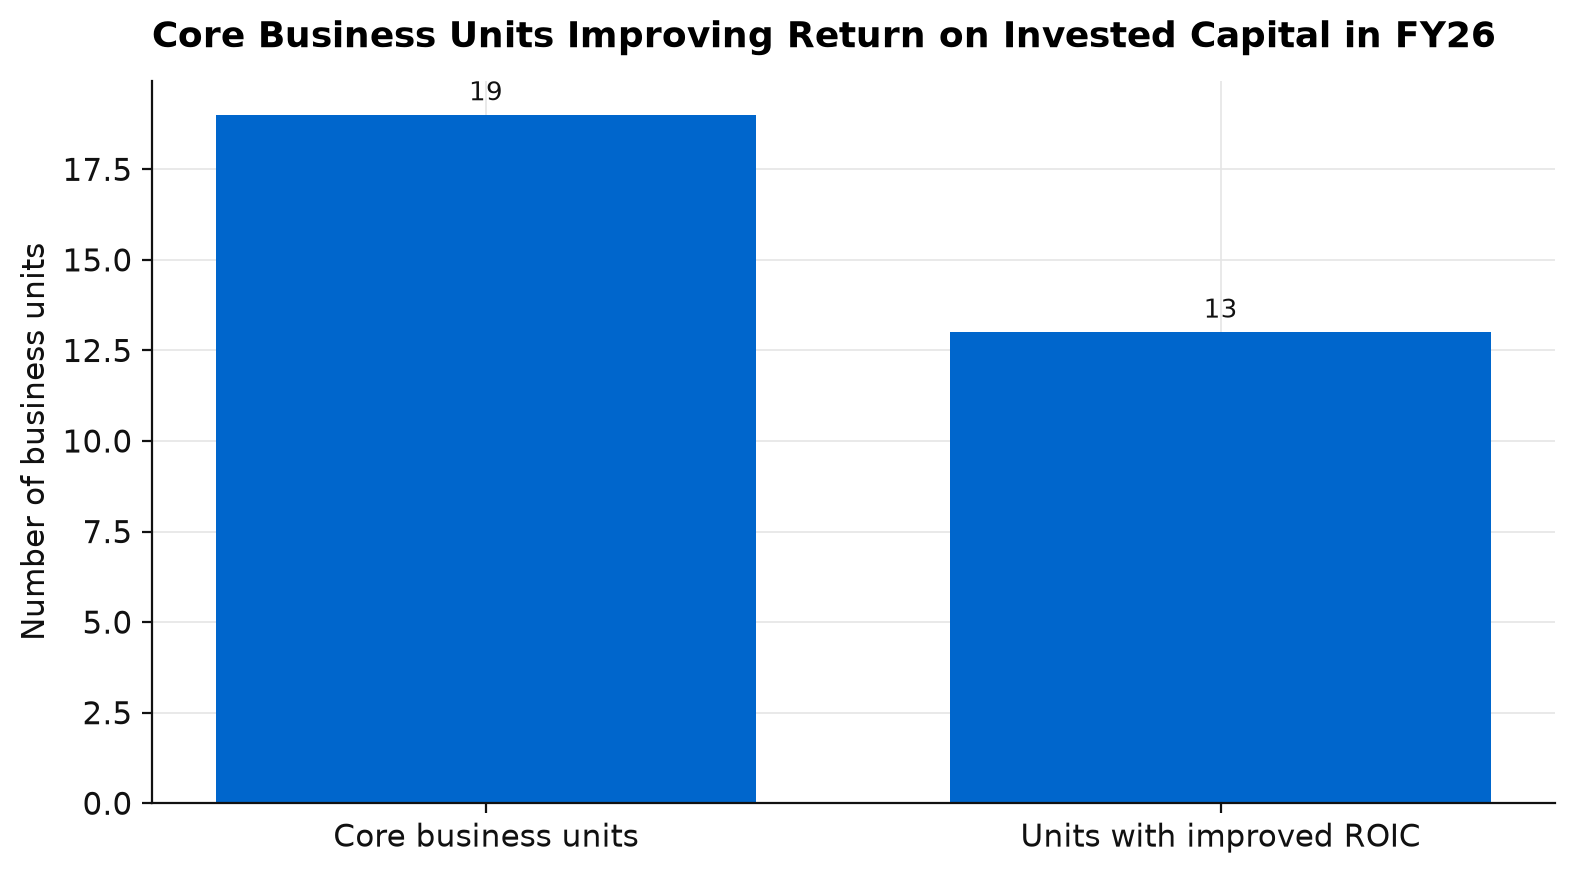
Become an AR or CARIn total, 13 of 19 core business units raised their ROIC. ROIC, or return on invested capital, measures how much profit a business earns on the money tied up in it, from plant and equipment to stock on hand. It is an important measure for a building materials group with a large asset base. With it rising across most of the portfolio, the improvement is spread widely through the group.
Management’s programme of business improvement and simplification is showing up in the numbers, and institutional sell-side research acknowledges that traction, but its Sell call turns on how much of it the share price had already built in.
Forecasts Move Up but the Lift Arrives in FY28
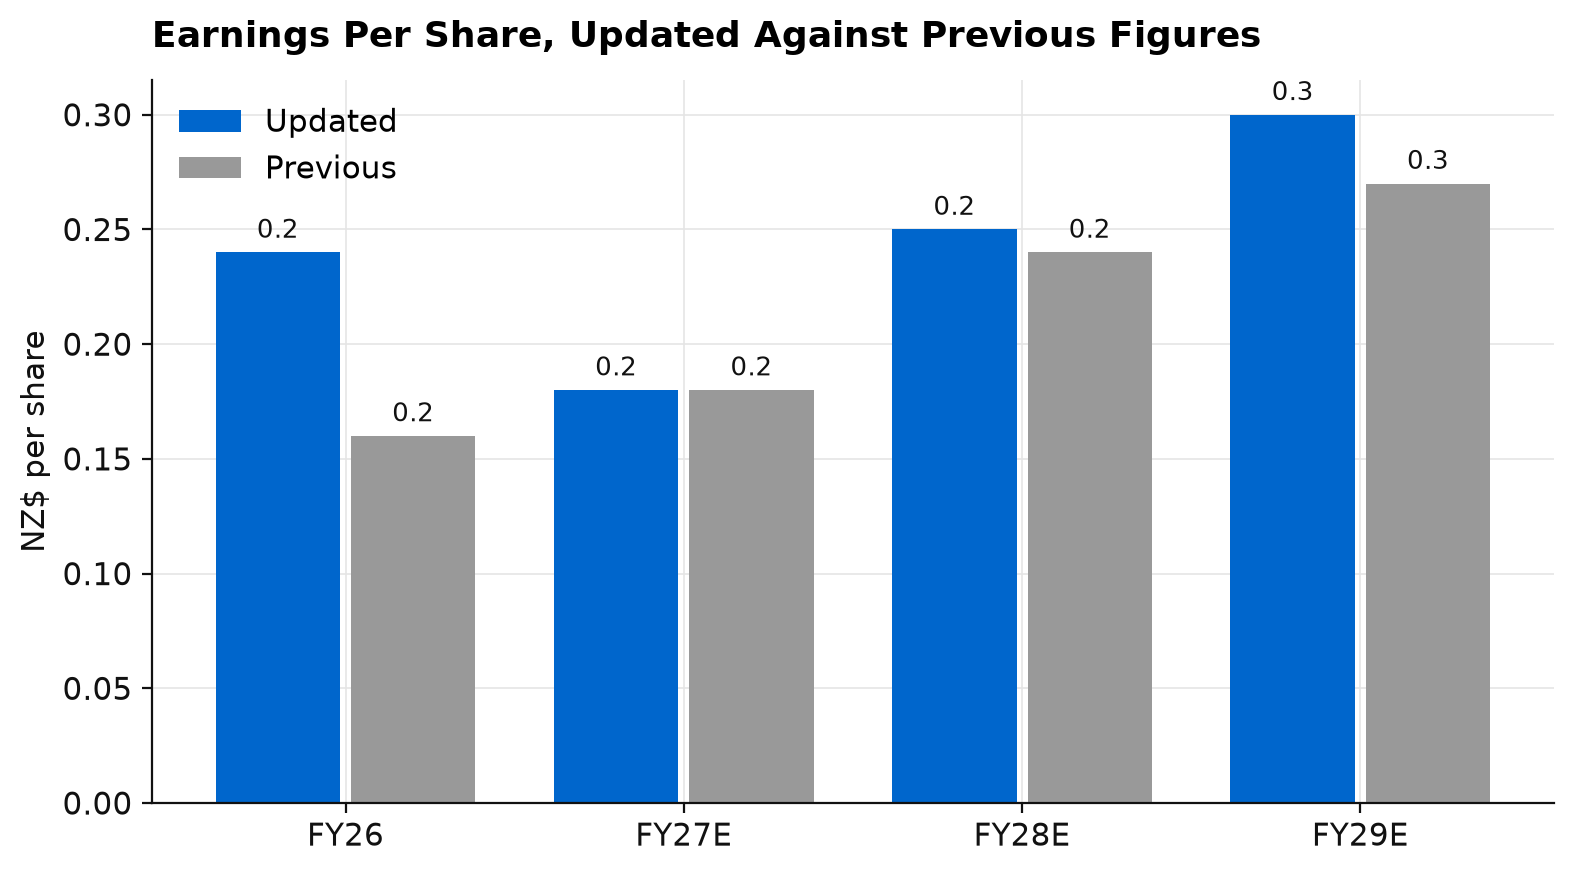
With earnings excluding surplus land sales modestly ahead, institutional sell-side research lifted its earnings per share forecasts by about 1 per cent for FY27 and about 7 per cent for FY28. Earnings per share, or EPS, is net profit divided by the number of shares on issue. The changes came from upgrades across the core manufacturing and distribution businesses, reflecting better than expected traction heading into FY27.
The updated figures have EPS of NZ$0.24 for FY26, then forecasts of NZ$0.18 in FY27, NZ$0.25 in FY28 and NZ$0.30 in FY29. The previous figures were NZ$0.16, NZ$0.18, NZ$0.24 and NZ$0.27 for the same years. Revenue is NZ$7,042.0m for FY26, against a previous forecast of NZ$6,908.2m. Revenue is then forecast at NZ$6,156.7m for FY27, NZ$6,595.1m for FY28 and NZ$6,913.6m for FY29, each revised up from previous forecasts of NZ$5,948.5m, NZ$6,343.4m and NZ$6,518.4m.
The forecasts fall in FY27 before recovering, which fits the pull-forward story. The half-year figures show the pattern more clearly. EPS was NZ$0.19 in the half to June 2026. The forecast for the half to December 2026 is NZ$0.07, followed by NZ$0.12 for the half to June 2027 and NZ$0.10 for the half to December 2027. The next set of results will probably look weaker than the one just reported.
Institutional sell-side research does not expect meaningful improvement in the building market until calendar 2027. With demand brought forward and no broad market recovery expected before then, the research sees upside to its forecasts only from FY28. Management was more optimistic about the second half of FY27, pointing to the uncertain economy, elections and the effect of pull-forward as reasons the first half will be harder.
So the coming year of results is unlikely to show the step up in earnings that the share price assumed at the result, and the recovery the research forecasts depends on the building market turning on schedule.
Valuation and What the Price Already Assumes
Institutional sell-side research lifted its 12 month price target 11 per cent to A$3.10 after the result, reflecting the earnings changes and updated valuation inputs. On the share price of A$2.93 when this research was published, that target sits about 5.8 per cent above. Institutional sell-side research retains its Sell rating.
A Sell rating alongside a target above the share price can look odd. When the research raised the target, it said the new level implied downside from the share price at the time, and the shares have since fallen, so the rating rests on what the price assumes about future earnings. The research compared the share price at the time of the result with how the market has valued Fletcher Building against the broader Australian share market over the past ten years. Applying that historical relationship, it estimated the market was implying EPS of NZ 26.5 cents. That is about 43 per cent above the level reported for FY26 from continuing operations, a year that itself included material surplus land sales. It is also slightly above prior market consensus forecasts for FY28.
The research has EPS at NZ$0.18 in FY27 and NZ$0.25 in FY28. Neither reaches the NZ 26.5 cents the market was implying. Only the FY29 forecast of NZ$0.30 gets there, and that is the year to June 2029. Getting there depends on a cyclical recovery arriving on schedule and on the improvement programme continuing to deliver, so the share price at the result was paying for earnings the forecasts do not show until FY29.
Three points support the Sell case. First, the headline FY26 EBIT included property sales, the beat against guidance was largely a one-off provision benefit, and some demand was brought forward ahead of price rises, so the result is weaker in quality than the headline implies. Second, FY27 forecasts show earnings falling before they rise, and no meaningful market recovery is expected until calendar 2027. Third, at the time of the result the price already assumed earnings well above anything recently reported, so much of the benefit of a recovery was already in the share price.
At A$2.93, the 5.8 per cent gap to the target is small for a cyclical building materials stock that pays no dividend and whose earnings must rise substantially to justify the current price. A late or smaller recovery would leave the shares exposed, and an early one is largely in the price already.
Key Risks
The main risk to a Sell call on Fletcher Building is a faster-than-expected recovery in its key end markets, particularly residential construction activity in New Zealand and Australia, which would lift volumes across the group ahead of the calendar 2027 timing the research assumes. The broader economy and the outcome of elections both feed into that housing cycle, and management itself flagged the uncertain macro backdrop and elections as factors for FY27. On the competitive side, a substantial reduction in competitive intensity would let the company push through price and margin gains faster than forecast. On execution, the improvement and simplification programme could deliver a structural lift in margins through further transformation, which earlier research work has identified as possible. Asset sales are the company-specific risk, since selling businesses or surplus property at good prices could release value and reshape the earnings base in ways the current forecasts do not capture.
Our View
We think the operational progress at Fletcher Building is genuine. Most of the core units are earning better returns, Distribution is back in profit, and net debt sits comfortably inside the target range, while the company has gained market share in a flat market. Our concern is timing and price: the building market is not expected to turn until calendar 2027, the first half of FY27 is forecast to be soft as the pull-forward unwinds, there is no dividend in the meantime, and at the result the share price already assumed a recovery. A market recovery showing up in reported results, or a share price closer to what near-term earnings support, would make the case look more balanced, and the FY27 half-year result is the next test.
If you would like to discuss Fletcher Building, request a callback or call us on 1300 889 603.
Financial Summary
Become an authorised representative
Advise your clients under an established AFSL without building your own. Choose AR or CAR.
Become an AR or CAR