
A rules-based quantitative approach to global equity markets.
Important risk information
The strategy has been trading with real money since 29 April 2026. Past performance is not a reliable indicator of future performance. The strategy trades two- and three-times leveraged ETFs, which are high-risk, can move sharply, and can decay in volatile or sideways markets, so you could lose a substantial part, or all, of the capital you invest. This is general advice only and does not take into account your objectives, financial situation or needs. Consider whether it is right for you, read our Financial Services Guide, and seek personal advice if you are unsure. Full disclosures are set out at the bottom of this page.
MFAM's Quantitative Leveraged ETF Strategy is a fully rules-based trading system combining three complementary quantitative engines, trend-following on the long side, mean reversion, and trend-following on the short side, across a basket of leveraged US and Chinese equity ETFs. In plainer terms, one engine rides rising markets, one buys sharp dips for the bounce back, and one is positioned for falling markets. All three run at the same time, and the rules lean on whichever engine suits what the market is doing. Every entry, exit, and position size is driven by mathematical rules. There is no discretionary override.
Built on the concepts taught in our free trading course
The trend-following, mean-reversion, volatility-adjusted stops and regime-filter frameworks that drive this strategy are the same concepts taught step by step in the MFAM free trading course. If you want to understand how and why this system works, the course walks through the underlying mechanics in plain language. Access the free trading course here.
The short version
- A diversified basket of leveraged ETFs across three engines, trend-following on the long side, mean-reversion, and trend-following on the short side. The engines are designed to lead in different market regimes.
- Cash account at Interactive Brokers, no broker margin. The investor holds custody of their own account. MFAM never holds investor funds.
- Non-discretionary general advice. Every trade signal requires the investor's explicit yes before the MFAM adviser places the order.
- Minimum investment AUD 20,000.
The full detail, covering the difference between alpha and beta, how the strategy manages market exposure, the drawdown framework, engine design, instrument selection, the development process and the access mechanics, is set out in the sections below.
To step through the mechanics, the paperwork to open the Interactive Brokers account, and how the strategy is delivered, book a callback with an MFAM adviser. The administrative side of running the strategy, including custody, signal delivery and adviser execution, is set out in How You Access the Strategy at the bottom of this page.
Request a CallbackPrefer to learn the fundamentals first? Access the free trading course.
Live Record
Important: this is a very short record
A record this short can be misleading. The strategy has traded with real money only since 29 April 2026, less than a year. It uses leveraged ETFs that move two to three times as much as the market, so a few months of results can look much better or much worse than the strategy will do over a full market cycle. Don't use these figures to judge the strategy or to decide whether to invest.
- Past performance is not a reliable indicator of future performance.
- Leveraged ETFs are high risk. You could lose a large part of your investment, and losses can come quickly.
- These figures come from the director's own self-managed super fund account, scaled to a $20,000 starting balance. That account doesn't pay MFAM's trade fee, so a client's returns would be lower.
- The comparisons are ordinary, unleveraged ASX-listed ETFs, shown only as a market reference. They are not like-for-like with a leveraged strategy.
- This is general information only. It doesn't take into account your objectives, financial situation or needs.
From 29 April 2026 to 8 October 2026, a $20,000 account grew to $24,594, a return of +23.0% (not annualised).

| Month | Strategy | World ex-AU (VGS) | Nasdaq 100 (NDQ) | ASX 200 (STW) |
|---|---|---|---|---|
| April 2026 (from 29 Apr) | -1.46% | -0.23% | +0.30% | -0.51% |
| May 2026 | +8.21% | +5.60% | +10.89% | +0.96% |
| June 2026 | +10.52% | +3.06% | +3.05% | +0.82% |
| July 2026 | -6.28% | -1.22% | -6.93% | +2.32% |
| August 2026 | +8.15% | +0.81% | +1.46% | +1.42% |
| September 2026 | +3.16% | +1.93% | +5.86% | -2.43% |
| October 2026 (to 8 Oct) | -0.21% | +0.75% | +3.04% | -1.35% |

Alpha vs Beta
The first number most investors look at is return, but return alone hides how it was earned. Not all returns are created equal, and a strategy's return has to be broken down into two very different components before it can be judged.
Beta is market exposure
Beta is the portion of a strategy's return that comes from simply being in the market. If the S&P 500 goes up 10 per cent in a year, a fully invested portfolio that moves in lockstep with it will also go up roughly 10 per cent. Nothing clever happened. The market rose, and the investor was along for the ride. Anyone willing to press a single buy button on an index ETF can collect beta. It requires no analysis, no timing, and no discipline.
Critically, beta is not free. It comes with full participation in market losses. The same passive portfolio that captured the upside will sit through the full drawdown when the market falls. The investor has no defence against a bear market. They accept whatever path the market delivers, peaks and troughs alike.
Alpha is return that does not come from market exposure
Alpha is what is left over after the beta portion has been accounted for. It is the portion of return attributed to the manager's own decisions, whether timing, selection, risk management, or all three. Alpha is what separates an active strategy from a passive one. When a strategy delivers return that cannot be explained by market exposure alone, and delivers it with risk characteristics that are measurably different from a passive market allocation, that is alpha.
The distinction matters because alpha and beta are valued very differently. Beta is effectively free, available for a fraction of a per cent in management fees through any index ETF. Alpha is scarce, because it requires a source of edge that most market participants do not have. Decades of academic and industry research confirm that consistent alpha is rare.
How the strategy manages market exposure
The strategy uses rules to pull capital out of the market when conditions no longer support its trading signals, and to deploy capital more aggressively when conditions do. A passive buy-and-hold investor has no mechanism to do either. They are always fully exposed regardless of whether the environment is favourable. This selective exposure is applied mechanically by the rules rather than discretionarily by a human, and the regime filter that drives it is explained further down the page.
Why Maximum Drawdown Is the Number That Actually Matters
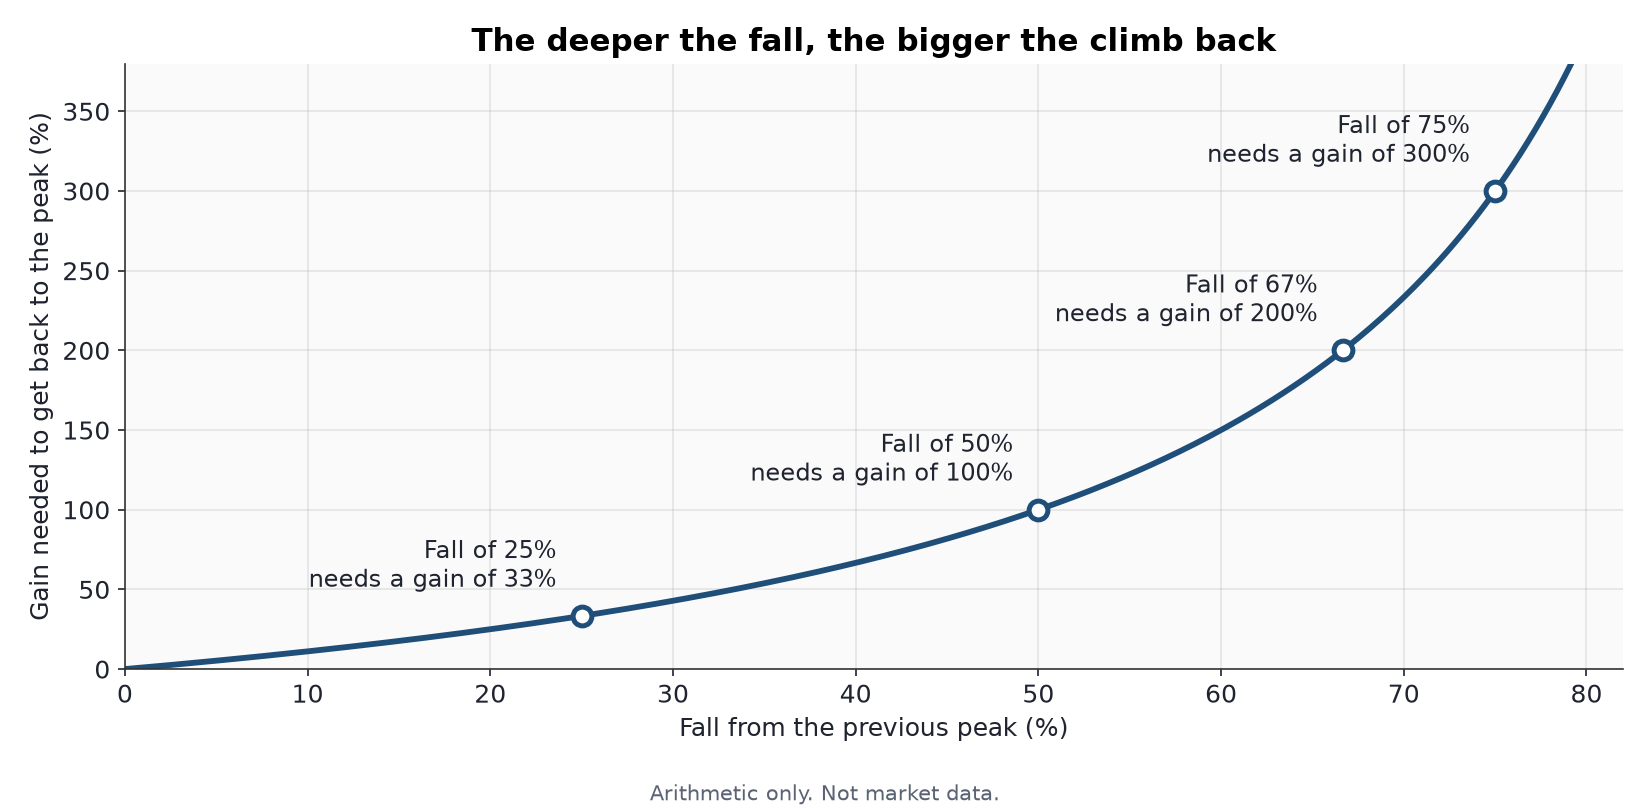
Most investors focus on return. Experienced investors focus on drawdown, because the arithmetic of recovery is unforgiving. A loss and a subsequent gain of the same percentage do not cancel out. The deeper the drawdown, the more disproportionate the recovery required.
A 50% drawdown requires a 100% gain to break even, which at historical equity market return rates takes roughly seven years. A 75% drawdown requires a fourfold return and realistically may never be recovered within an investor's remaining time horizon.
What drawdowns look like in this type of strategy
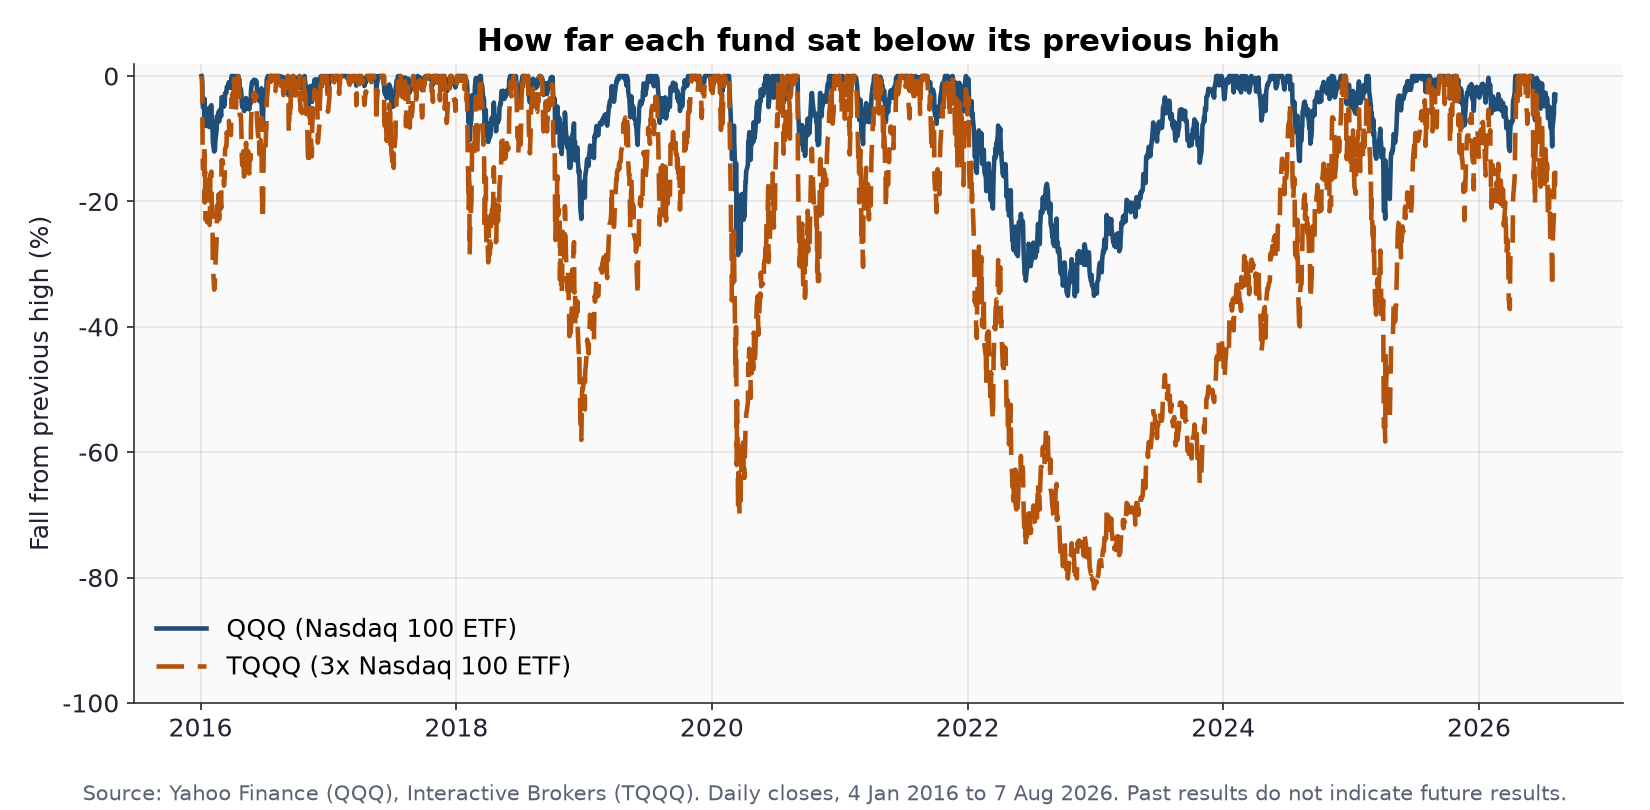
A feature of a leveraged-ETF strategy worth understanding is that its largest drawdowns tend to follow its largest rallies. The two- and three-times leveraged instruments produce outsized spikes during favourable regimes, and any subsequent consolidation is measured against that spike.
Real market history shows the same effect. The chart below compares QQQ, an ETF that tracks the Nasdaq 100 index, with TQQQ, a fund that targets three times the index's daily move. TQQQ is one of the instruments the strategy trades, and the chart shows the fund, not the strategy.
A second, structural driver of these events is the trend engines' own design. Trend-following systems, on either the long or short side, are built to capture the bulk of a sustained move, not to exit at the top. The exit signal requires confirmation that the trend has weakened, which happens after the peak rather than at it. That confirmation requirement is what allows the system to ride extended trends without being shaken out by mid-trend pullbacks. The cost of that patience is that a portion of the final leg of every trend is given back before the exit fires. This give-back is part of the design: the engine accepts it in exchange for being able to hold a position through an extended trend. A trend system built to avoid give-back would also exit much earlier in every trend.
Entry timing
An investor whose capital enters right at a peak experiences the full peak-to-trough drawdown because their starting NLV is that peak. Anyone deploying capital into the strategy should size their exposure against their ability to tolerate a substantial drawdown from the day they enter. A drawdown can be deeper or longer than expected, and exposure should be sized with that in mind.
To step through the mechanics, the paperwork to open the Interactive Brokers account, and how the strategy is delivered, book a callback with an MFAM adviser. The administrative side of running the strategy, including custody, signal delivery and adviser execution, is set out in How You Access the Strategy at the bottom of this page.
Request a CallbackPrefer to learn the fundamentals first? Access the free trading course.
How It Works
The strategy runs three engines in parallel, each trading different signals across different instruments. The three engines are designed to work in different market regimes so that the strategy as a whole has exposure to trending up, trending down, and mean-reverting environments.
Trend-Long Engine
Identifies established uptrends using a combination of momentum indicators, moving-average filters, and a regime-detection layer. The engine stays out of the market when broader conditions do not support long-side trend-following. Exits are driven by volatility-adjusted trailing stops that tighten as a trade moves in favour.
Mean-Reversion Engine
Identifies short-term oversold conditions in volatile sectors and takes positions sized to capture rebounds. Exits again use volatility-adjusted stops, with discipline around capturing the first material reversion move rather than holding for extended trends.
Trend-Short Engine
The mirror image of the trend-long engine, applied to the inverse leveraged ETFs of the same underlying indices. It activates when sustained downtrends are confirmed by the regime layer, so the strategy can hold a position that rises when those indices fall, rather than sitting in cash. Exits use the same volatility-adjusted stop framework as the trend-long engine.
Three Engines, Three Trade Profiles
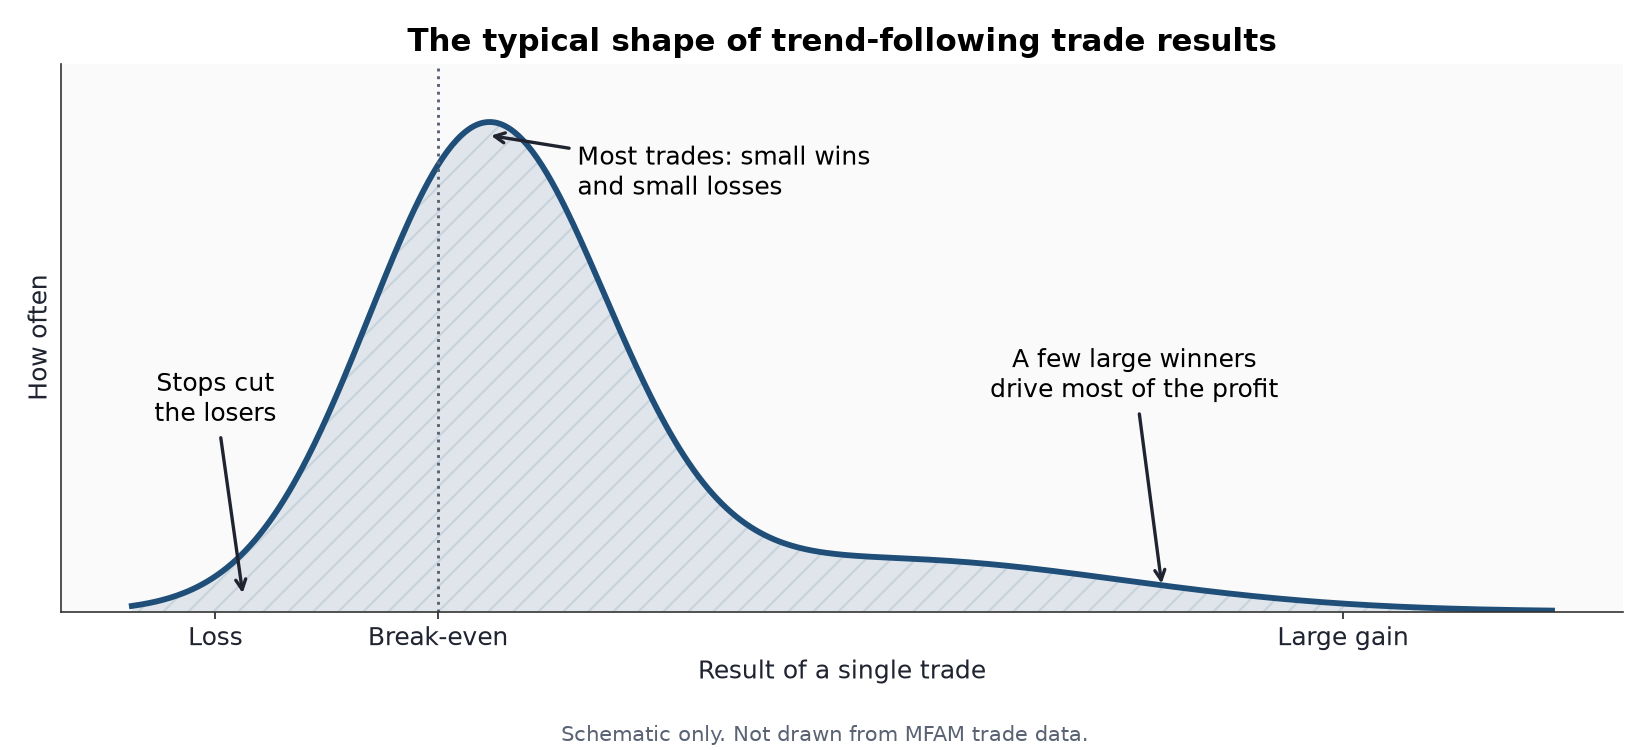
The three engines produce very different trade shapes. The two trend engines are designed to catch extended directional moves and hold them through a sustained leg, which typically means multi-week to multi-month hold times. The mean-reversion engine is the opposite, entering after a short sharp dislocation and exiting as soon as price snaps back, often within a few days. Results depend on the distribution of outcomes across many trades rather than on any single trade being reliable. In trend-following, a small number of large winners typically contributes most of the profit, as the trades section below explains.
How the Three Engines Switch Across Regimes
The three engines are designed to have different exposure patterns. When long-side trend conditions are poor, the regime filter pulls the trend-long engine into cash. When short-side trend conditions activate, the trend-short engine takes over net exposure. The mean-reversion engine fills in when neither trend regime is dominant. By design, leadership rotates depending on what the market is doing.
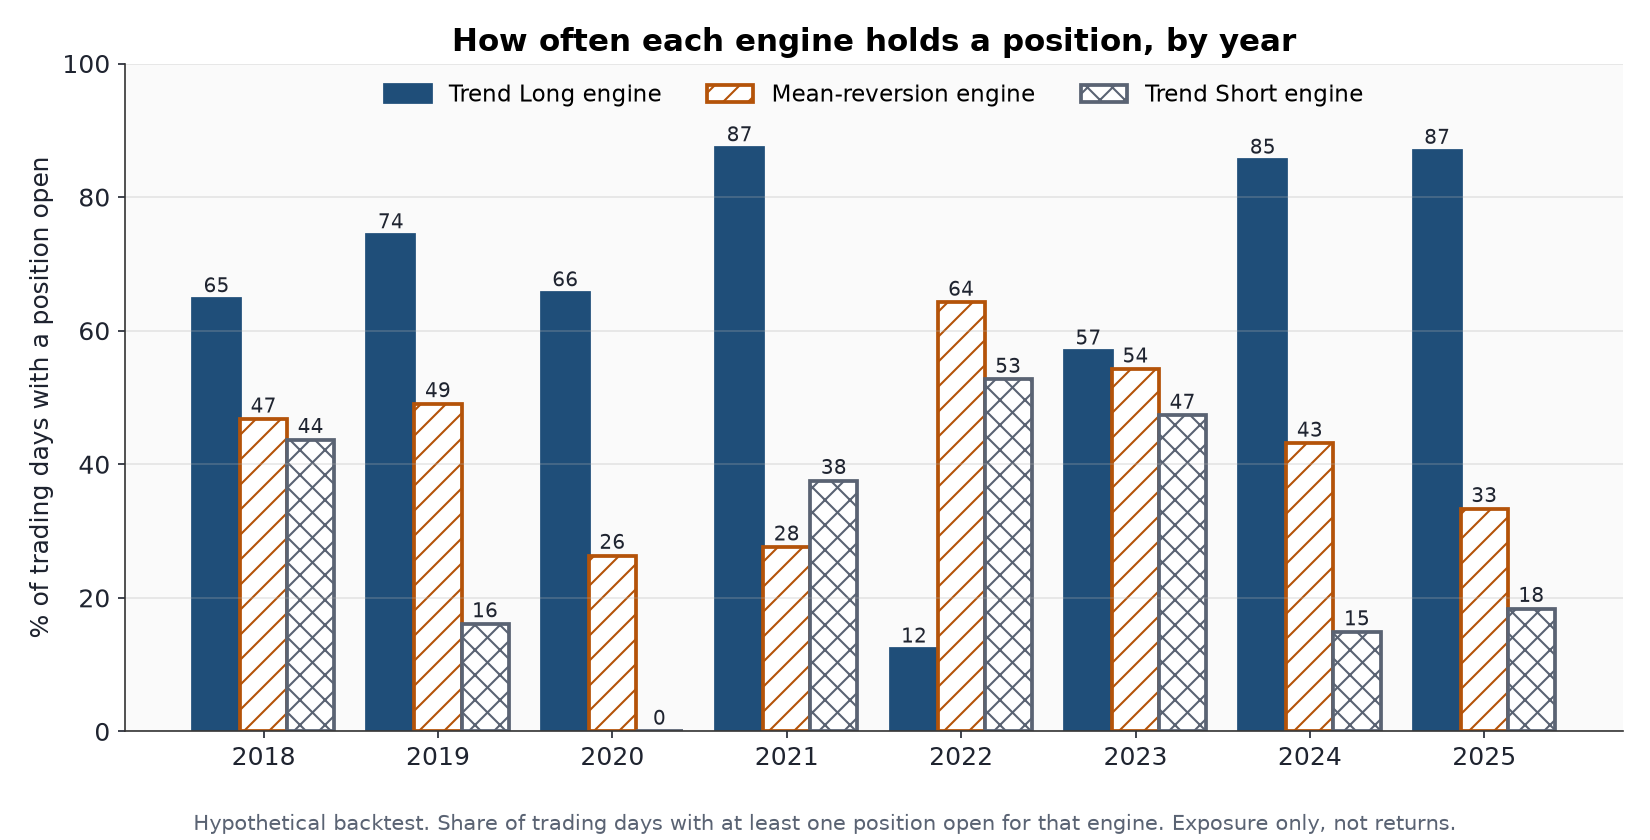
This rotation is designed so that net market exposure adapts to the current regime rather than running at a fixed level. The regime filter and the trend-short engine together are designed to remove or reverse capital exposure when the environment does not support the long-side signal. Reducing exposure does not eliminate the risk of loss, and a strategy that trades two- and three-times leveraged instruments can still fall sharply.
Why combining the three engines matters
Running only a trend-long strategy can expose an investor to long periods of poor performance when markets stop trending up. Running only a mean-reversion strategy tends to miss extended trends during bull runs. Running only a short-side strategy is structurally negative-carry against rising long-run equities. Combining all three gives the strategy something to do in every regime, which is the rationale for running the engines together.
Proprietary Signal Calibration
All three engines use a proprietary approach to signal tuning, designed to respond to changes in market regime.
For a plain-language walkthrough of the trend, mean-reversion, regime-filter and volatility-stop concepts this strategy is built on, access the free MFAM trading course.
Instrument Selection
The strategy trades a diversified basket of leveraged exchange-traded funds. Instrument selection is deliberate and follows three principles. The first is that each instrument must sit in a market segment whose behaviour suits the method applied to it. The second is non-overlapping exposure. Each leg tracks a distinct sector or geography, so an adverse event in one does not cascade across the book. The third is liquidity. Every instrument is a top-tier ETF with deep order books, so fills are reliable and position sizing is not constrained.
Leverage is used intentionally. The two- and three-times-leveraged structure amplifies the move in the underlying index in both directions, so leverage magnifies losses as much as it magnifies gains. The same leverage is what makes stop-loss discipline and regime filtering central to the design.
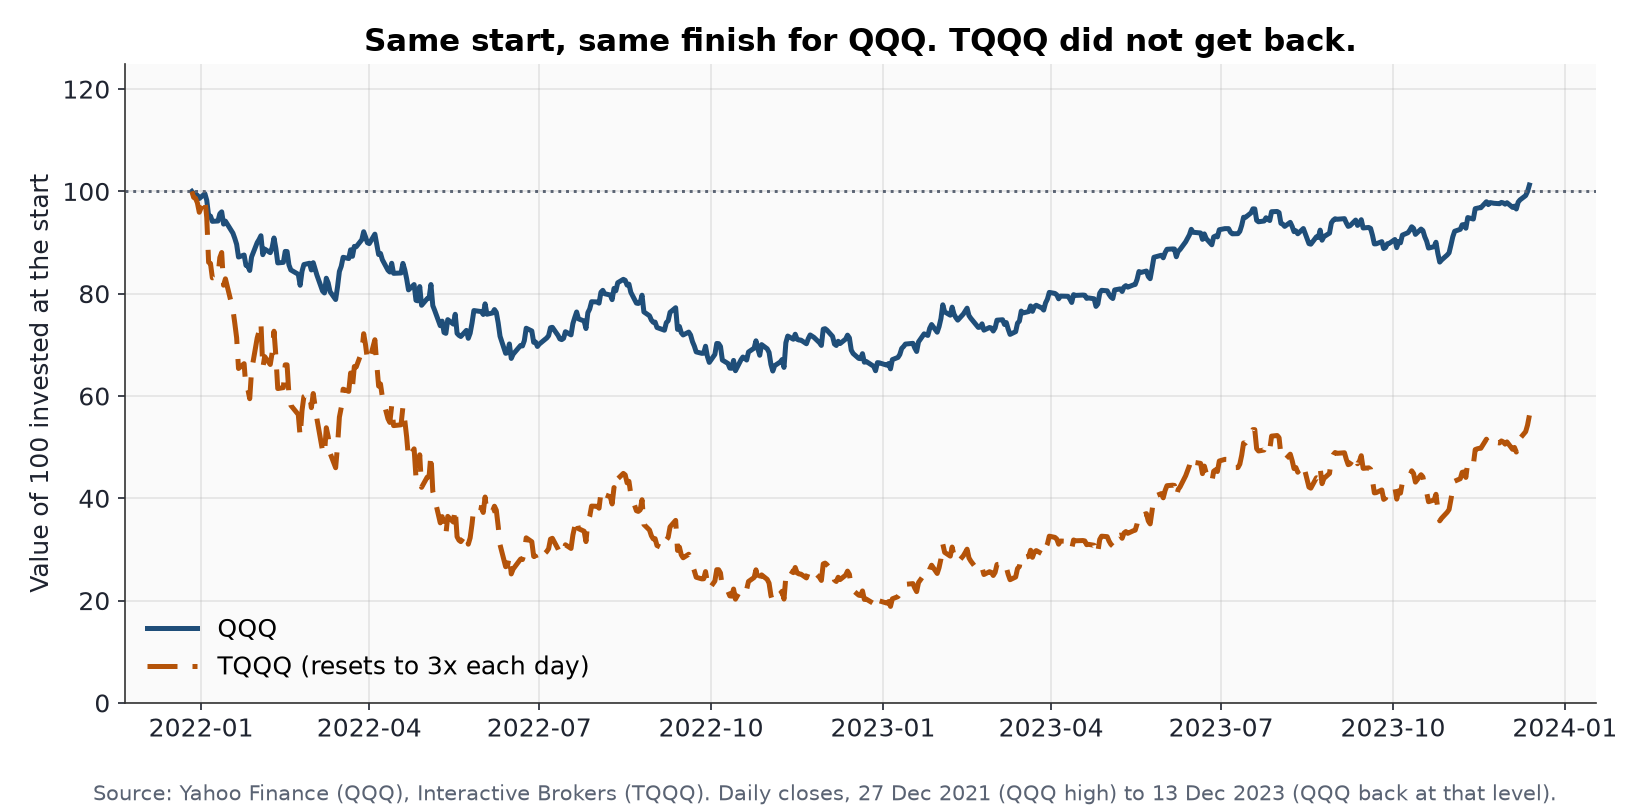
These funds reset their leverage every day, so a choppy market can wear them down even when the index itself goes nowhere. The chart below is a real example: from QQQ's 2021 high to the day it first got back to that level, QQQ finished level while TQQQ finished well below where it started.
US large-cap technology, dominated by globally scaled businesses whose earnings trajectories unfold over quarters and years rather than days. It is the deepest and most liquid leveraged ETF in the universe and the reference exposure for the US growth complex.
The semiconductor cycle combines a multi-year secular growth layer, driven by compute demand, artificial intelligence and industrial electrification, with a pronounced inventory cycle on top of it. It behaves distinctly from broad technology despite the overlap in constituents.
Chinese equities move on a different set of drivers from US markets, including domestic policy cycles, stimulus rounds and property-sector dynamics. The exposure is deliberately non-US, so the book is not a single bet on the American cycle.
The artificial-intelligence and infrastructure build-out is the dominant multi-year capex theme in US equities. The basket sitting underneath AIBU captures that flow at the index level rather than through any single name.
Biotech is among the most idiosyncratic sectors in US equities, with binary clinical-trial outcomes, FDA decisions and acquisition flow. Its drivers are close to unrelated to the macro forces that move the rest of the book.
Defense names move on geopolitical headlines, defense-budget cycles and programme-specific news, against an underlying thesis of sustained government spending that is structurally stable. Its calendar has little in common with the technology complex.
Energy is among the most volatile sectors in US equities, driven by oil-price shifts, OPEC decisions and geopolitical events, with earnings power anchored by large integrated producers. It is the clearest commodity-linked exposure in the universe.
Junior gold miners carry operating leverage to the gold price: a small move in the underlying commodity produces an outsized move in the equity. Gold's drivers, principally real yields, the dollar and macro stress, are the ones least shared with any other leg.
Healthcare reacts sharply to drug-pricing headlines, policy proposals and single-name trial failures, while its earnings base sits with large, diversified pharmaceutical and managed-care businesses. Its defensive demand profile means it responds to different events from the energy, defense and gold-miner legs.
The inverse counterpart to TQQQ, giving the book a route to the same underlying index when it is falling rather than rising.
The inverse counterpart to SOXL. Semiconductor sell-offs are typically as sharp and persistent as semiconductor rallies, driven by the same cyclical inventory dynamics in reverse.
The inverse counterpart to YINN. Chinese equity sell-offs driven by policy tightening, property-sector stress or geopolitical events are largely uncorrelated with the direction of US markets.
The inverse counterpart to AIBU. AI-thematic drawdowns can run for months once established, driven by the same capex-cycle dynamics in reverse.
The inverse counterpart to LABU. Biotech sell-offs run for the same reasons biotech rallies do, often in extended drawdowns when capital rotates out of small-cap risk.
Where the other inverse legs are sector or country exposures, SPXU is the broad-market one. Its role is the sell-off that is not confined to technology, semiconductors or China but is instead a general de-rating of US equities.
Every Trade Matters
Trend-following typically has a modest win rate, with a small number of large trends tending to drive the results while stop-losses cut the losing trades. Investors should expect long stretches where results go sideways between those trends.
Why every signal is taken
The strategy takes every signal as it fires, without discretionary filtering. The largest winners in a trend-following system cannot be reliably identified in advance, and skipping setups that look low-conviction would risk passing on the very trades that drive results, so the rules-based discipline is to act on every signal. The trend engines hold winners for weeks to months and the mean-reversion engine cycles within days, so the engines contribute in different ways.
To step through the mechanics, the paperwork to open the Interactive Brokers account, and how the strategy is delivered, book a callback with an MFAM adviser. The administrative side of running the strategy, including custody, signal delivery and adviser execution, is set out in How You Access the Strategy at the bottom of this page.
Request a CallbackPrefer to learn the fundamentals first? Access the free trading course.
Is This Just Curve Fitting?
A fair question to ask of any quantitative strategy is whether its rules have been retro-fitted to historical data until the results look good. This is called curve fitting, and it is the single most common failure mode of quantitative research. A curve-fit strategy will show a beautiful historical track record and then fall apart the moment it is asked to trade on data it has not seen. The historical numbers were engineered into existence, not discovered.
Curve fitting is easy to do accidentally. Any strategy has parameters, and any parameter can be tuned until the historical result is maximised. If you try enough combinations on the same dataset, something will fit that dataset almost perfectly by coincidence alone. The fit says nothing about the future because the rules were selected for that specific history, not for any underlying market behaviour. A properly engineered quantitative strategy has to be built in a way that makes this kind of overfitting structurally difficult.
How to tell curve fitting from a real edge
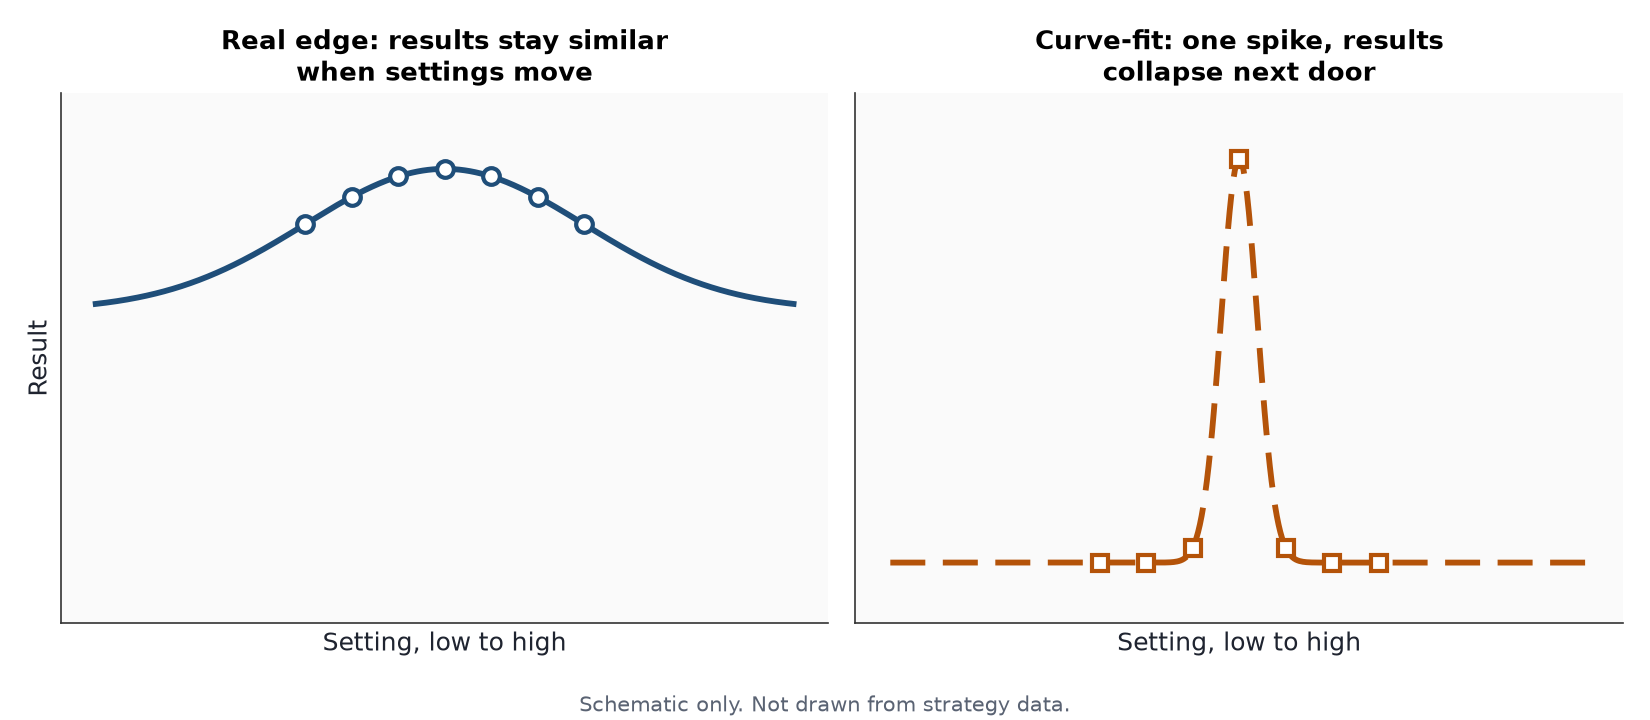
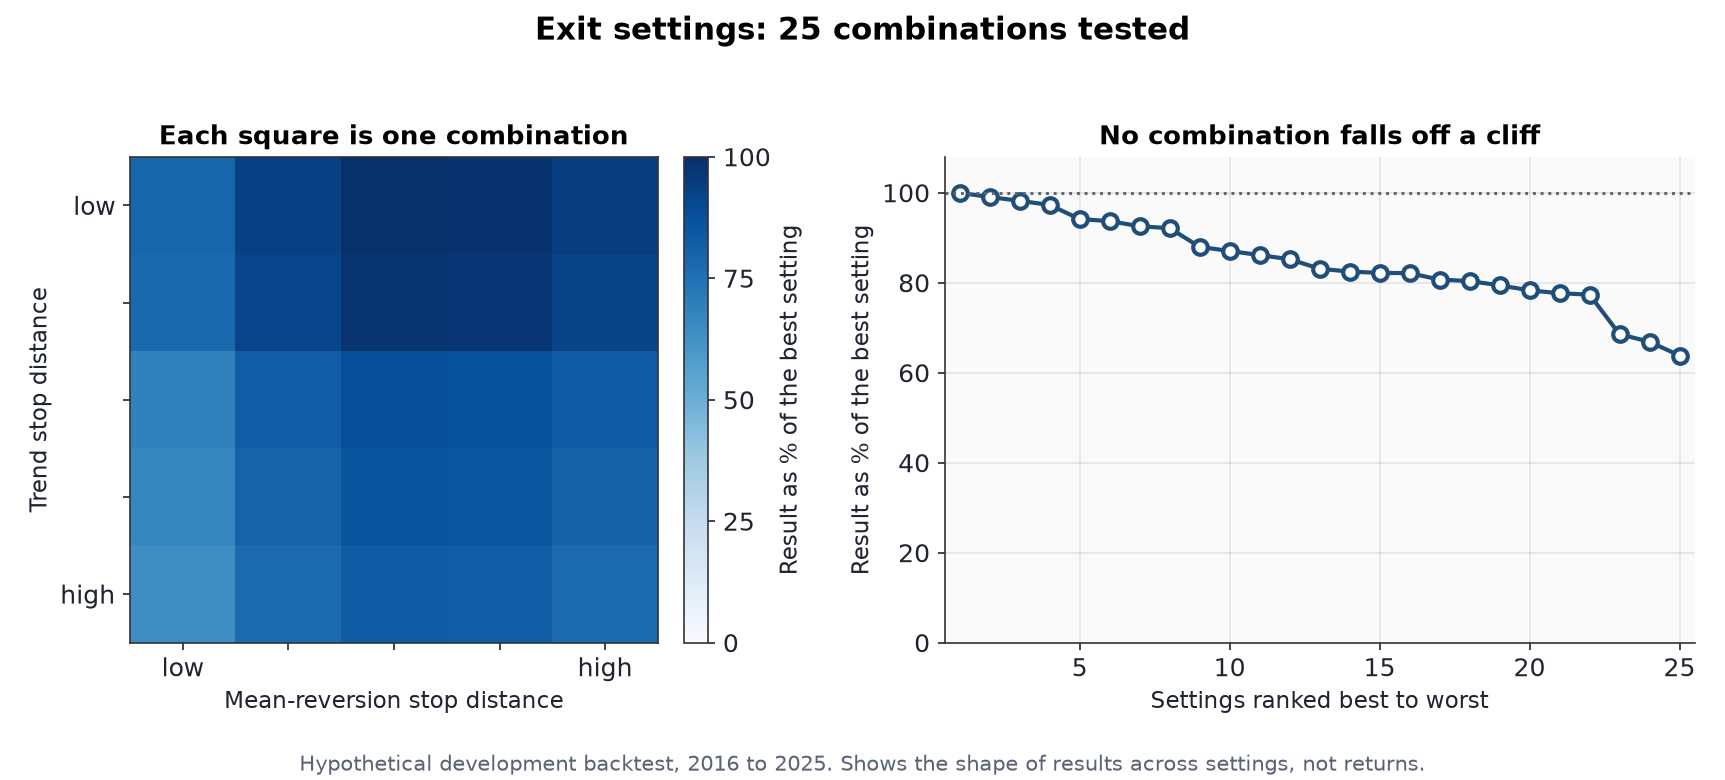
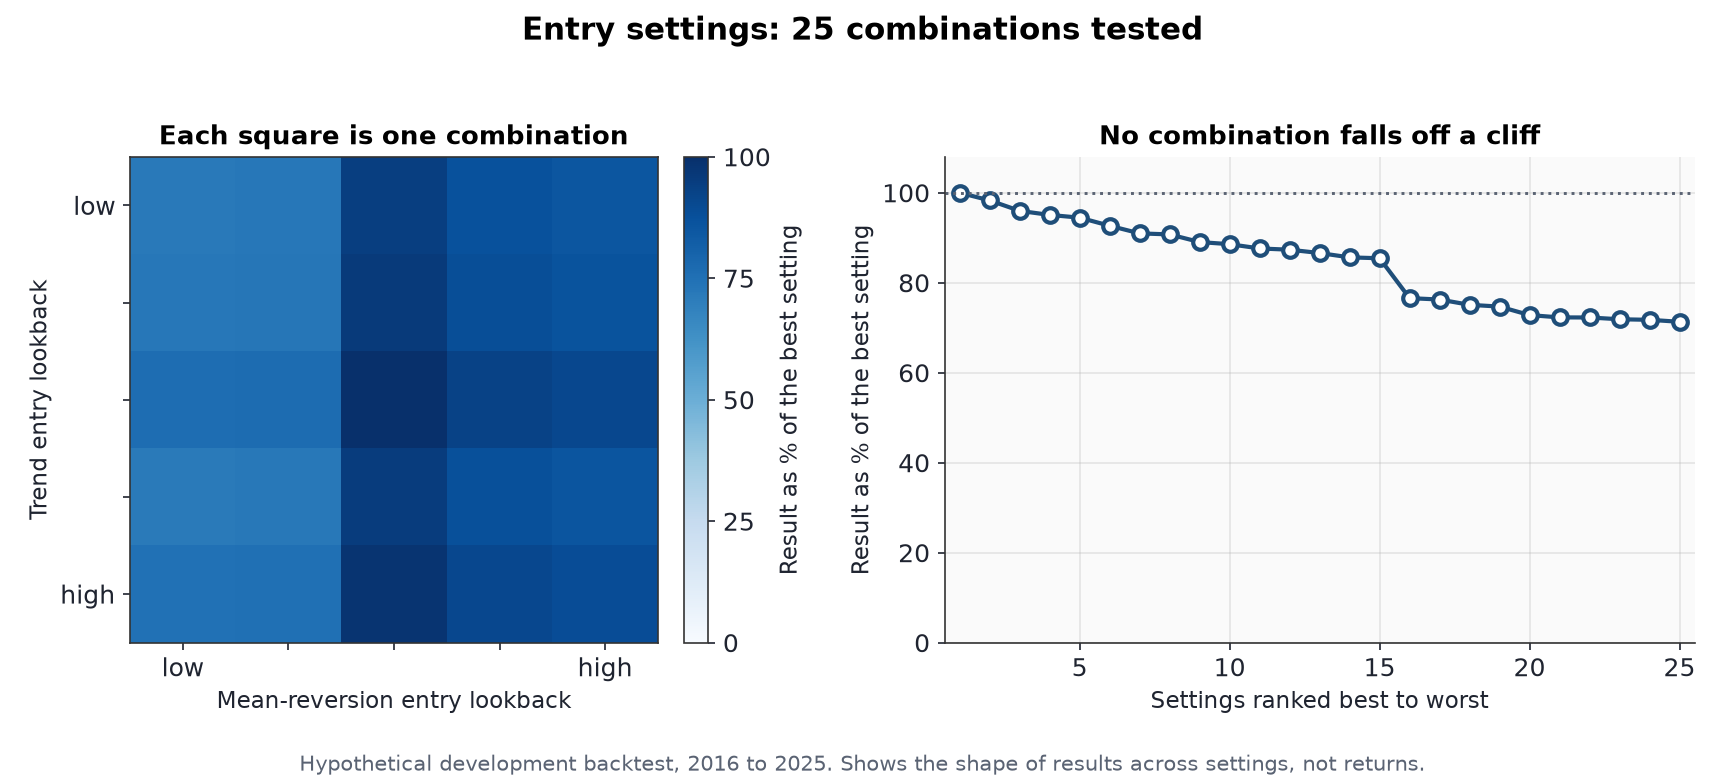
The cleanest test is a parameter sweep. Take the finished rules, move each setting across a wide range of reasonable values, and look at the results. If performance collapses when a setting moves slightly, the original result was a coincidence at one specific setting. If results change gradually and nothing collapses, the rules are doing the work rather than the exact numbers.
How the settings were chosen
When testing was finished, we did not deploy the single best-looking settings. We deliberately chose settings from the middle of a whole neighbourhood of similar settings, so that if the market shifts a little, or our calibration is slightly off, the strategy is less likely to change character.
The two sweeps below were run on the development version of the strategy, before the trend-short engine was added, over 2016 to 2025. Each tests 25 combinations of two settings, one on each engine, and shows every result as a percentage of the best combination in that grid, so the shape is visible without showing returns. The settings themselves are not disclosed.
Exit settings
Entry settings
How the strategy was developed
The development process itself was designed to resist curve fitting, in three deliberate stages.
Stage one was building the base logic on unleveraged instruments. The trend and mean-reversion engines were designed and tested against one-times ETFs tracking the same underlying exposures, where signal behaviour is cleaner and leverage-related decay does not distort the data. The goal in this stage was to establish whether the underlying trading rules captured real market behaviour, independent of any amplification.
Stage two was testing on data outside the development window, in both directions. The engines were built and their parameters chosen on a development window. It was then tested in two directions. Going backwards, the rules were run against an earlier window that predates the build window and had not been used during development. Going forwards, the rules were run against a later window that had been deliberately held out of the build. The purpose was to check whether the rules had been curve-fit to the development data.
Stage three was calibrating for the two- and three-times leveraged instruments actually deployed. Leverage changes the risk profile materially. In this stage the volatility-stop multiples and regime-filter thresholds were re-tuned, using the later window that had been held out, to accommodate the faster, larger moves that leveraged ETFs produce. This calibration did not change the underlying logic. It adjusted the risk-taking envelope so the same rules would operate on instruments that amplify every move by a factor of two or three. The rules themselves were not refit, only the risk-sizing parameters were recalibrated for leverage.
Current Status
The strategy is trading with real money on a live Interactive Brokers account.
To step through the mechanics, the paperwork to open the Interactive Brokers account, and how the strategy is delivered, book a callback with an MFAM adviser. The administrative side of running the strategy, including custody, signal delivery and adviser execution, is set out in How You Access the Strategy at the bottom of this page.
Request a CallbackPrefer to learn the fundamentals first? Access the free trading course.
How You Access the Strategy
The strategy is delivered as non-discretionary general advice. MFAM generates the signals and, once the investor authorises each one, the MFAM adviser places the order on the investor's behalf. The mechanics below are how that works in practice.
Your account, your custody
The investor opens their own account at Interactive Brokers. The account and all cash deposits are legally held by the investor, with client cash sitting in Interactive Brokers' segregated trust account under Australian and United States client-money rules. MFAM does not hold, pool, or control investor funds at any point. The account is yours, the money is yours, and you can close the account or withdraw at any time without MFAM's involvement. The MFAM adviser is added to the account as an authorised adviser with trading authority only, so orders can be placed on the investor's behalf once authorised, but cash cannot be moved out of the account by MFAM.
Signal delivery
General advice trade signals are issued to the investor by email and SMS during the trading day as the rules fire. Each signal is a specific instruction, the instrument, the side, and the size expressed as a percentage of portfolio. The investor only needs to reply yes to authorise. No action from the investor means no trade.
Execution
Once the investor has authorised a signal, the MFAM adviser places the order on the Interactive Brokers account. Orders are typically placed as market-on-open for the next United States session, which executes overnight Australian time.
Non-discretionary by design
Every trade requires explicit authorisation from the investor before it is placed. The MFAM adviser does not have discretion to enter or exit positions without a yes from the investor. This is general advice with client-authorised execution, not a managed account and not a managed fund. The investor decides whether any given signal is actioned, and can decline a signal or exit a position at any time.
Risk level is fixed, exposure scales with investment amount
The instruments used are a mix of two- and three-times leveraged ETFs, and the strategy's risk profile is fixed by its design rather than chosen by the investor. A rules-based position-sizing framework, with built-in per-position and portfolio-level risk limits, defines one risk profile that every investor receives. The only dial the investor controls is how much capital to allocate to the strategy. A larger allocation produces a larger absolute swing in dollar terms, while the per-leg risk budget remains the same regardless of investment size.
Cash-account structure, no broker margin
The strategy is engineered to run on an unmargined cash account. The investor's broker account holds the cash and the long ETF positions outright. There is no broker margin in use, no overnight financing or borrow cost, and no margin-call mechanic. Losses on any individual trade are managed by the position size and the volatility-stop, not by a forced-liquidation cascade triggered by a margin requirement.
The leverage in the strategy comes from inside the underlying ETFs themselves. Direxion and similar issuers manage the daily rebalancing within each fund, and the investor pays for that operational service through the fund's expense ratio rather than through any borrow charge on their own account. This structure removes a class of failure mode (the gap-down forced-liquidation that ends careers in conventional margin-leveraged trading) and is the reason a strategy of this kind can be run on a standard SMSF or retail brokerage cash account without margin-derived blow-up risk. Position-level losses on the underlying leveraged ETFs themselves remain real and material, and are managed by the strategy's volatility-stop and per-leg risk-cap framework.
Minimum investment
The strategy is offered from a minimum investment of AUD 20,000. There is no per-trade dollar minimum and no fixed monthly or platform fee. The all-in 30 basis-point per-fill charge applies on every entry and exit regardless of trade size, which is estimated at around 5 per cent per annum at the strategy's expected trading frequency. On an AUD 20,000 account that is approximately AUD 1,000 in annual fees. Fee specifics are discussed during the onboarding conversation with an MFAM adviser.
You have seen the full mechanics, the risk profile, and exactly how the account, signals and execution work in practice. The next step is a short conversation with an MFAM adviser to walk through the Interactive Brokers paperwork and any questions on the system before you start.
Request a CallbackWant the fundamentals first? Take the free 5-day trading course.
General Advice Warning
The information on this page is general advice only. It is general in nature and does not take into account your individual objectives, financial situation, or needs, and it is not personal financial advice. Before acting on any information presented here, you should consider its appropriateness having regard to your own circumstances, read our Financial Services Guide, and where relevant consider the Product Disclosure Statement for any financial product referred to. If you are unsure whether the strategy is right for you, seek personal advice.
Portfolio Construction
The strategy runs as a single shared pool across all three engines. Each leg is sized by a rules-based risk-budgeting method that scales position size to the instrument's recent volatility, with per-position and portfolio-level limits that cap total exposure when several signals fire at once. In deployed operation the engines run on a single Interactive Brokers account so that the position-sizing base across the deployed legs is the live portfolio NLV.
Commissions and Fees
The strategy's fee is an all-in 30 basis-point per-fill charge applied to the notional traded on every entry and every exit. It bundles the MFAM management commission, broker commissions, bid-ask spread, and the realistic execution slippage of trading the underlying leveraged ETFs into a single number. There is no separate management fee, performance fee, or platform fee charged on top. Exchange and regulatory pass-through fees, which a broker always passes through on top of commissions, sit outside this 30 bps figure. The strategy runs on an unmargined cash account so there are no financing or borrow costs to apply. Tax depends on the individual investor's circumstances.
Past Performance
Past performance is not a reliable indicator of future performance.
Leveraged Instruments
The strategy trades leveraged exchange-traded funds. Leveraged ETFs carry materially higher risk than their unleveraged counterparts and can experience significant decay in volatile or sideways markets. They are not suitable for all investors and are generally inappropriate as long-term buy-and-hold investments. The strategy's rules-based approach seeks to manage this risk, but cannot eliminate it.
No Guarantee
MF & Co. Asset Management makes no representation or guarantee regarding the future performance of the strategy. Returns may be negative. You may lose capital.
About MFAM
MF & Co. Asset Management Pty Ltd (ABN 99 622 929 597) holds Australian Financial Services Licence (AFSL) 520442. This page has been prepared for general information purposes. To discuss the strategy, speak with an MFAM adviser.