The Equity Portfolio
The equity side is deliberately ordinary. It holds large Australian companies, concentrated mostly in the top 20 by market capitalisation, which is where the dividend yield, the franking, and the liquidity are. There is no attempt to trade this portfolio actively. It is the long-term holding, and it is expected to behave like a large-cap Australian share portfolio, with the falls that implies in a bad year for the ASX.
Two features matter for the strategy as a whole. The first is franking. Australian companies that pay tax at the company rate attach franking credits to their dividends, and Australian resident investors can use those credits against their own tax. For an investor on a low tax rate, including many SMSFs, the credits are a material part of the total return and they do not show up in the share price. The second is eligibility. Holding the portfolio in ASX 200 names is not a style preference, it is what makes the shares acceptable to the clearing house as cover. A portfolio built outside the ASX 200 would not be accepted as general cover, so it would support no options book at all.
The Options Strategy
The XJO options market is one of Australia’s deepest and most liquid derivatives markets. The strategy systematically sells iron condors, which is a four-legged position: sell a put below the index and a call above it, then buy a further-out put and a further-out call as protection. The sold options bring in premium. The bought options cap the damage if the index runs a long way in either direction.
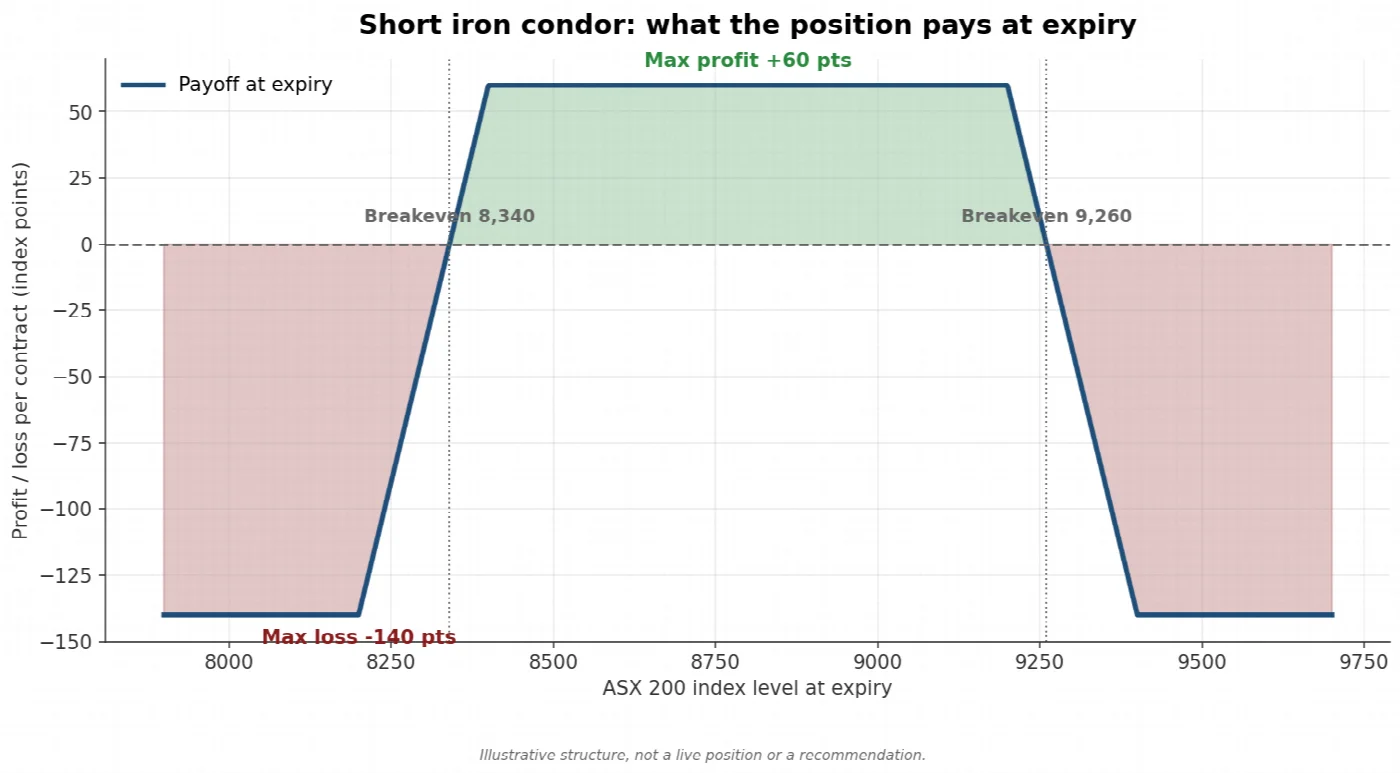
The payoff at expiry of a short iron condor, drawn in index points. Profit is at its maximum anywhere between the two sold strikes and is capped at the net premium received. Losses are capped by the bought wings. Illustrative structure, not a live position or a recommendation.
Three features of the XJO contract shape how the strategy is run. XJO options are European exercise, which means they can only be exercised on the expiry day, so there is no risk of being assigned early on a position that has moved against you. They are cash settled against the index, so no shares change hands at expiry and the equity portfolio is never called away. And the contract has a tick value of $10 per index point, which is what turns an index level into a dollar exposure. All three are set out in the ASX Index Options fact sheet, which describes XJO options as cash settling against the value of the S&P/ASX 200 and as European style.
Returns on this side of the strategy are generated by the decay of option time value rather than by the index going up. That is what makes the options book’s behaviour structurally different from the share portfolio sitting underneath it. Strike selection, position size and expiry management are decided each cycle from where the index is trading and what volatility is being priced at the time.
Where the Income Comes From
Most strategies rely on predicting direction. This one does not. It targets a well-documented gap between what the options market expects the index to do and what the index then does.
The gap is measurable. The S&P/ASX 200 VIX, published as A-VIX, is the market’s estimate of how much the index will move over the coming 30 days, as priced into XJO options today. That estimate can be compared with the volatility that actually turned up over the following 30 days. The chart below does that month by month across the whole published history of the index, from January 2008, pairing what was priced at the start of each month against what the index went on to deliver over the following month.
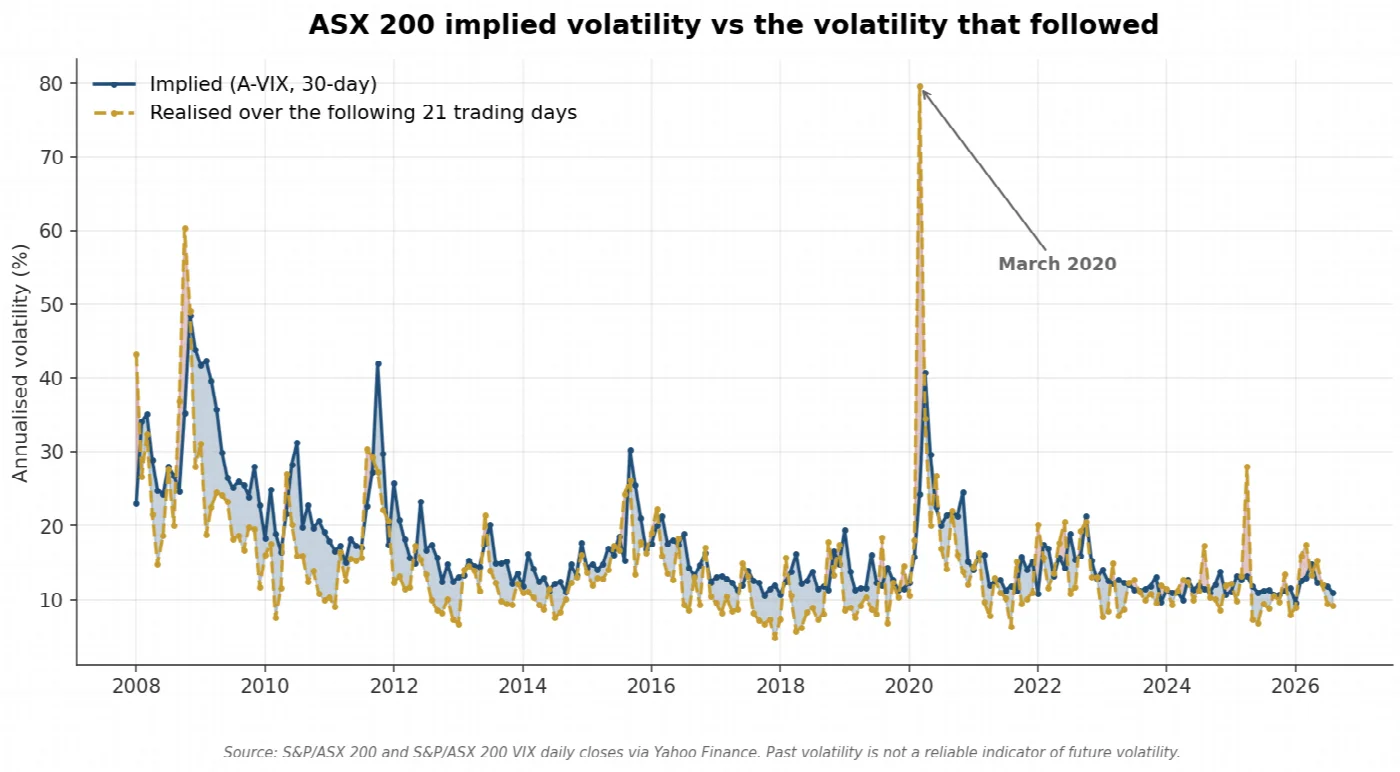
One observation per month. Implied volatility priced into 30-day XJO options at the start of each month, against the volatility the index actually delivered over that month. Blue shading marks the months where the market paid for more movement than it got, red shading the months where it paid for too little.
Implied sits above realised most of the time, and it sits a long way below it occasionally. Measured across every one of the 4,704 trading days from January 2008 to August 2026, implied volatility averaged 17.1 against 14.6 for the realised volatility that followed, an average gap of 2.43 volatility points, and implied was the higher of the two on 75.5 per cent of those days. The widest premium of any year in the record was 2009, the year after the crisis, when fear stayed priced into options long after the market itself had settled down.
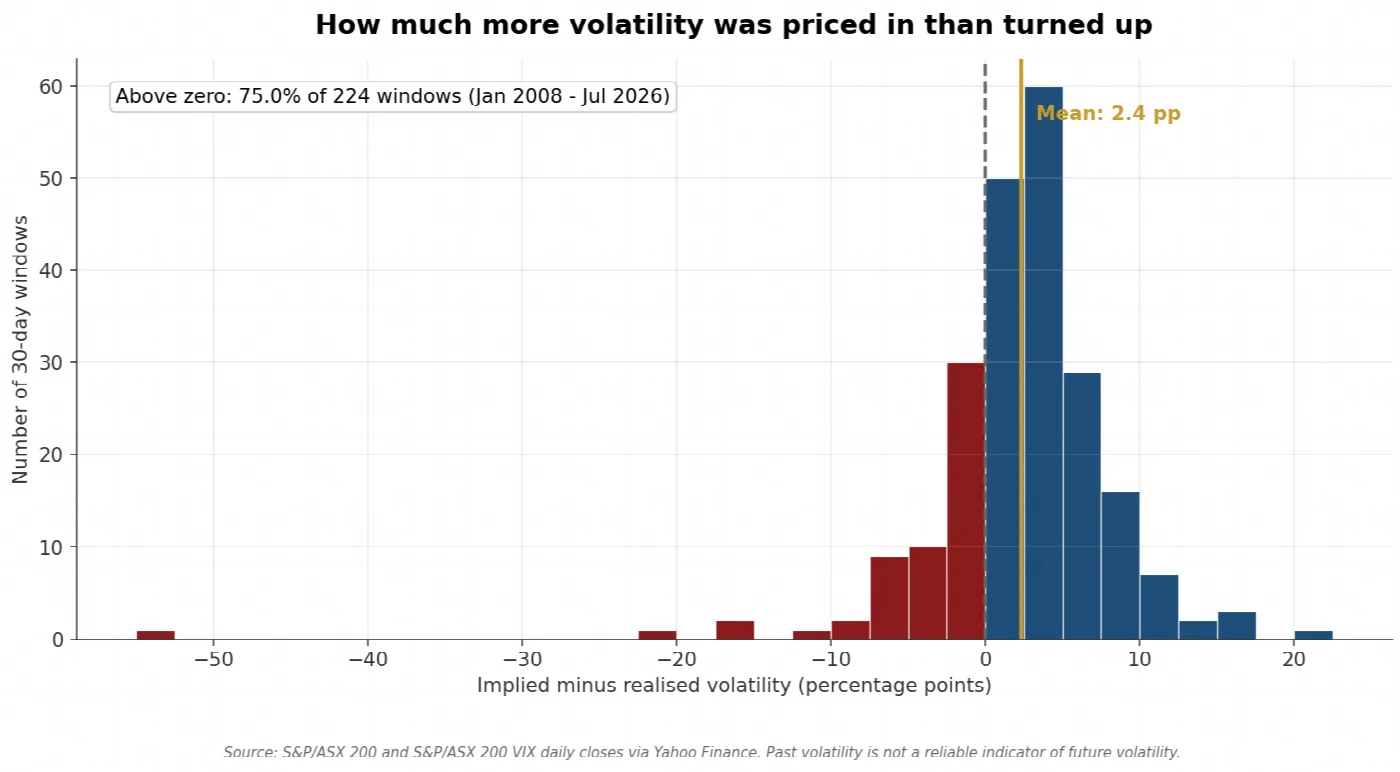
Each bar counts one window, taken end to end since January 2008 so that no window is counted twice. Bars to the right of zero are windows where the market priced in more movement than it got. Bars to the left are the windows where it priced in too little.
Counting each month once rather than every day separately gives the same answer, which is the check that matters. Splitting the record into non-overlapping windows produces a positive gap in between 73.7 and 76.8 per cent of windows depending on where the first window starts, and an average gap between 2.27 and 2.70 points. The result does not depend on how the data is cut.
That shape is the whole thesis in one picture, and the left tail is as important as the right. The premium exists because investors persistently pay above fair value for portfolio protection, which is a rational thing for them to do when the alternative is carrying the risk themselves. The seller on the other side collects that overpayment in most months and hands a large part of it back in the months when the market turns out to have been right to worry. Nothing guarantees the pattern continues, and the record above includes long stretches where the gap was much thinner than its average.
Delta neutral at entry
A position’s delta measures how much it moves when the index moves. The condor is constructed to start at roughly zero delta, which means that at the moment it is opened it is not a bet on the market rising or falling. Income is earned from the passage of time rather than from picking a direction, which is what makes the return stream structurally different from equity returns.
Neutral at entry is not the same as neutral for the life of the trade, and that distinction is where most of the work is. As the index moves, the position’s delta drifts, and a condor that started neutral quietly becomes a directional bet. Managing that drift is covered below.
Why Time Decay Matters
An option’s price has two parts, the intrinsic value and the time value. Time value is the amount a buyer pays for the possibility that the option finishes further in the money, and it goes to zero at expiry with certainty. For the buyer that is a cost of carry. For the seller it is the income.
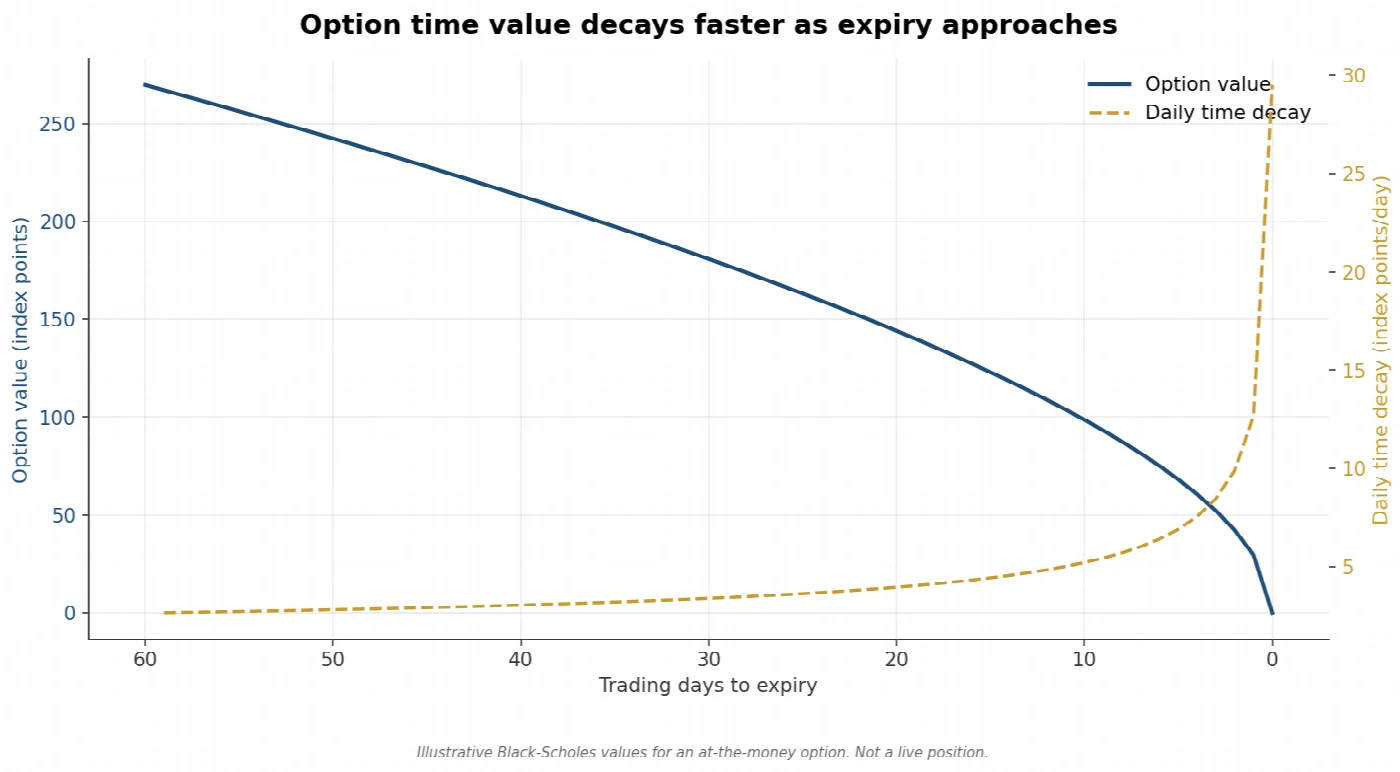
Time value of an at-the-money option as expiry approaches, with the per-day rate of decay shown alongside it. Decay is slow when there is plenty of time left and accelerates into the final weeks. Illustrative Black-Scholes values, not a live position.
The important detail in that chart is the shape, not the level. Decay is not linear. It is slow at first and accelerates sharply into expiry, which is why the strategy works in defined cycles and does not simply sell the longest-dated option available. The same acceleration that pays the seller near expiry is also when the position becomes most sensitive to a sudden move, which is the gamma problem discussed in the risk section.
Decay is only collected if the index cooperates. Time value falling to zero is certain. Whether the index is inside the sold strikes when it gets there is not.
What the Index Actually Does
A range-based strategy is a bet on the ordinary behaviour of the index rather than on a forecast. So it is worth looking at what the ordinary behaviour has been.
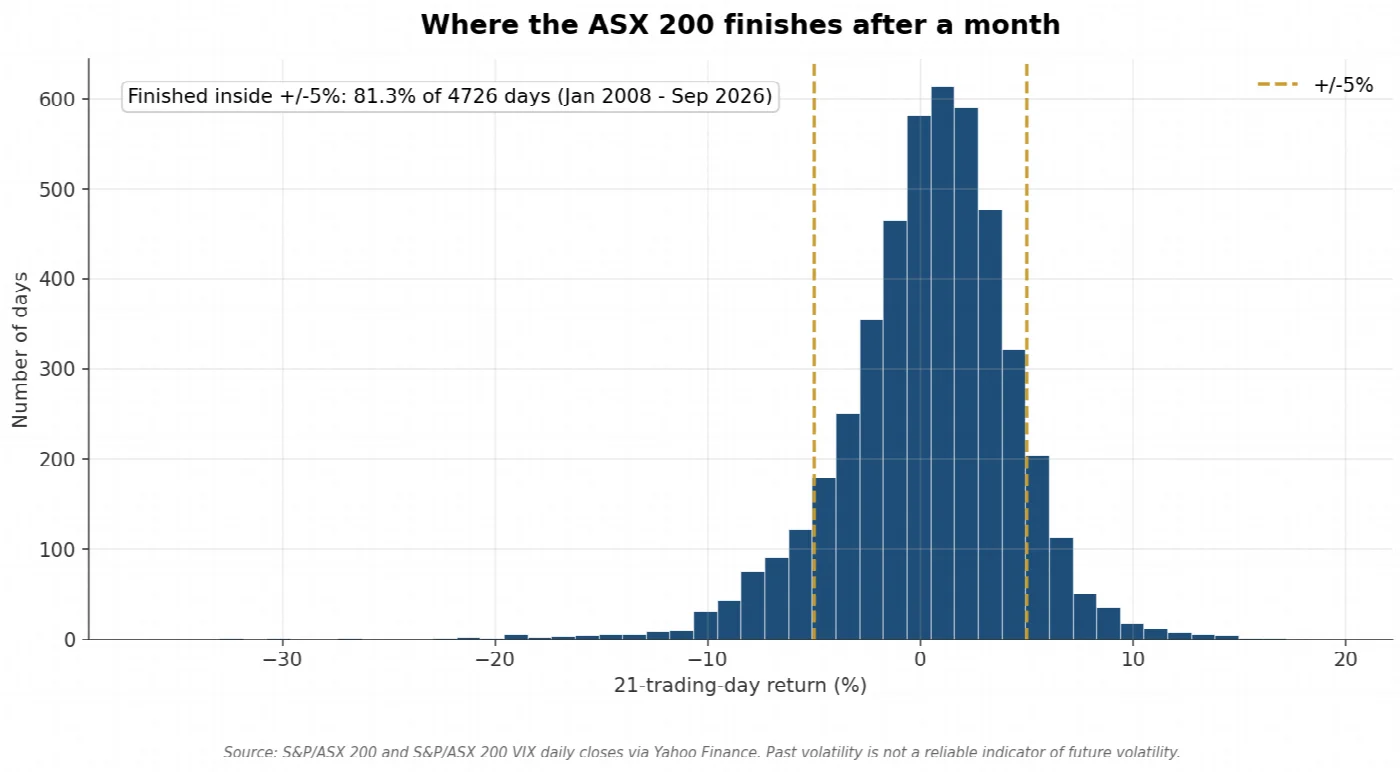
Where the S&P/ASX 200 finished after each 21-trading-day period since 2008, which is roughly the length of one options cycle. The gold lines mark plus and minus 5 per cent. This measures the finishing point, which is what a cash-settled option pays out against, not the path taken to get there.
Over a 21-trading-day window, which is about the length of one options cycle, the ASX 200 finished within 5 per cent of where it started on 81.3 per cent of days since 2008, and within 3 per cent on 58.6 per cent of them. The median absolute move was 2.48 per cent. The index spends most of its time going not very far, which is the behaviour the strategy is designed to monetise. The tail on that distribution is also visible, and it is the reason the bought wings are part of the structure rather than an optional extra.