
Two income streams from one pool of capital. A quality ASX portfolio that pays dividends and franking credits, doing double duty as collateral for a systematic index options book.
Market data on this page covers January 2008 to September 2026, the full published history of the ASX 200 volatility index.
Important risk information
This page shows no performance record. MFAM does not publish a track record for this strategy, and nothing below should be read as a forecast of what it will earn. The charts on this page describe how the ASX 200 and its options market have behaved historically, not what any account has returned. Writing options involves significant risk, including the loss of more than the premium received. Shares lodged as collateral are exposed both to their own price falls and to the obligations of the options book they support, so a bad month can cost you on both sides at once. This is general advice only and does not take into account your objectives, financial situation or needs. Consider whether it is appropriate for your circumstances, read our Financial Services Guide, and seek personal advice if you are unsure. Full disclosures are set out at the bottom of this page.
Most portfolios work in one dimension. Capital either grows or it generates income. The Integrated Portfolio Strategy is built to do both from the same assets. A quality Australian share portfolio, concentrated mostly in the top 20, provides the foundation, and it pays dividends, franking credits and long-term capital growth in the ordinary way. Those same shares are then lodged as ASX Clear-approved collateral to support an active XJO index options strategy, which generates a second stream of premium income on top.
The short version
- Two engines, one capital base. Australian blue chips pay dividends and franking credits. The same shares are lodged as collateral so the options book does not need a separate cash allocation sitting idle beside it.
- The options engine sells iron condors on the S&P/ASX 200. It collects premium when the index stays inside a range, and the worst case on any single position is capped by the bought wings at the moment the trade is opened.
- The income source is the volatility risk premium. Since January 2008, implied volatility on the ASX 200 has averaged 17.1 against 14.6 for the volatility that actually turned up over the following month, and it has been the higher of the two on 75.5 per cent of trading days. That covers the entire published history of the index, including the global financial crisis.
- It is not a free lunch, and the losing months are the violent ones. Over the 30 days from 5 March 2020 the index delivered 80.7 per cent annualised volatility against the 22.1 per cent that had been priced, a gap of 58.5 points the wrong way. That is what a bad month looks like for a premium seller.
- Actively managed, not set and forget. Positions are monitored daily and adjusted as the index moves. The structural edge does not survive being left alone.
- Non-discretionary general advice. Every entry and every adjustment is issued to you as a signal, and nothing is placed until you authorise it.
- Built around $400,000 or more in investable capital, because position sizing and margin cover do not work cleanly below that.
- Portfolio advice fee $167 a month per $100,000, which is about 2 per cent a year, plus brokerage at $50 minimum or 0.5 per cent.
How the Two Engines Work Together
The structure is what makes this strategy different from holding shares and running an options account side by side. In the ordinary arrangement, the options account needs its own cash to meet margin, and that cash sits there earning very little. Here the share portfolio does that job. The shares stay invested, keep paying dividends and franking, and simultaneously stand behind the options book as approved collateral.
- ASX blue chips, concentrated mostly in the top 20
- Fully franked dividend income
- Long-term capital growth
- Lodged as ASX Clear approved collateral
- XJO index iron condors
- Premium collected from time decay
- Non-directional at entry by design
- Actively monitored and adjusted
Capital efficiency is the point of the design, and it cuts in both directions. One pool of capital supports two return streams instead of one. It also means a sharp fall in the share market hits the value of the collateral at the same moment it moves the index through the options book’s short strikes. The two engines are not independent of each other in a crisis, and the risk section below sets out what that means in practice.
The Equity Portfolio
The equity side is deliberately ordinary. It holds large Australian companies, concentrated mostly in the top 20 by market capitalisation, which is where the dividend yield, the franking, and the liquidity are. There is no attempt to trade this portfolio actively. It is the long-term holding, and it is expected to behave like a large-cap Australian share portfolio, with the falls that implies in a bad year for the ASX.
Two features matter for the strategy as a whole. The first is franking. Australian companies that pay tax at the company rate attach franking credits to their dividends, and Australian resident investors can use those credits against their own tax. For an investor on a low tax rate, including many SMSFs, the credits are a material part of the total return and they do not show up in the share price. The second is eligibility. Holding the portfolio in ASX 200 names is not a style preference, it is what makes the shares acceptable to the clearing house as cover. A portfolio built outside the ASX 200 would not be accepted as general cover, so it would support no options book at all.
The Options Strategy
The XJO options market is one of Australia’s deepest and most liquid derivatives markets. The strategy systematically sells iron condors, which is a four-legged position: sell a put below the index and a call above it, then buy a further-out put and a further-out call as protection. The sold options bring in premium. The bought options cap the damage if the index runs a long way in either direction.
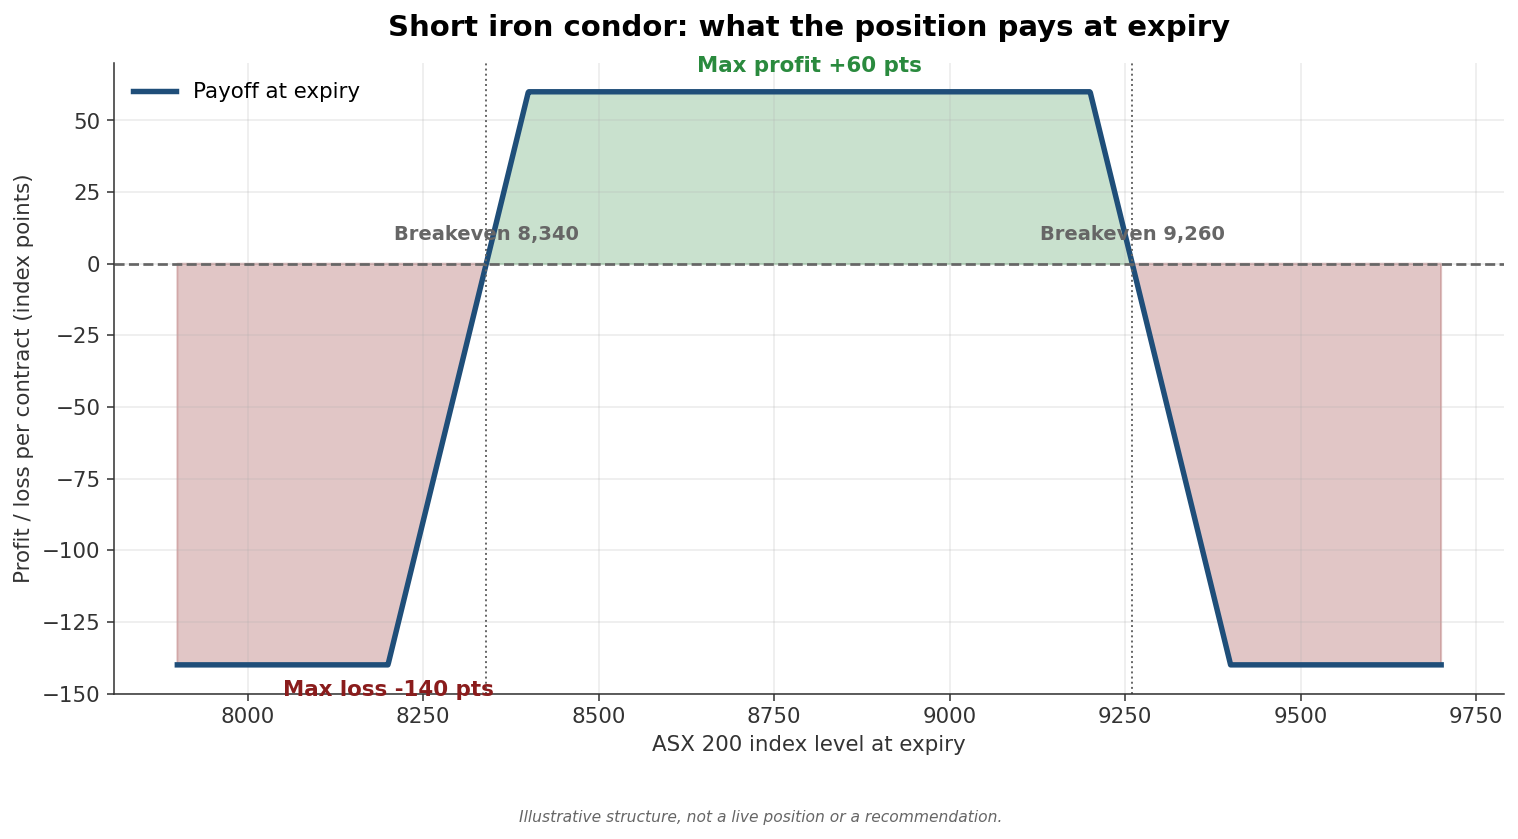
Three features of the XJO contract shape how the strategy is run. XJO options are European exercise, which means they can only be exercised on the expiry day, so there is no risk of being assigned early on a position that has moved against you. They are cash settled against the index, so no shares change hands at expiry and the equity portfolio is never called away. And the contract has a tick value of $10 per index point, which is what turns an index level into a dollar exposure. All three are set out in the ASX Index Options fact sheet, which describes XJO options as cash settling against the value of the S&P/ASX 200 and as European style.
Returns on this side of the strategy are generated by the decay of option time value rather than by the index going up. That is what makes the options book’s behaviour structurally different from the share portfolio sitting underneath it. Strike selection, position size and expiry management are decided each cycle from where the index is trading and what volatility is being priced at the time.
Where the Income Comes From
Most strategies rely on predicting direction. This one does not. It targets a well-documented gap between what the options market expects the index to do and what the index then does.
The gap is measurable. The S&P/ASX 200 VIX, published as A-VIX, is the market’s estimate of how much the index will move over the coming 30 days, as priced into XJO options today. That estimate can be compared with the volatility that actually turned up over the following 30 days. The chart below does that month by month across the whole published history of the index, from January 2008, pairing what was priced at the start of each month against what the index went on to deliver over the following month.
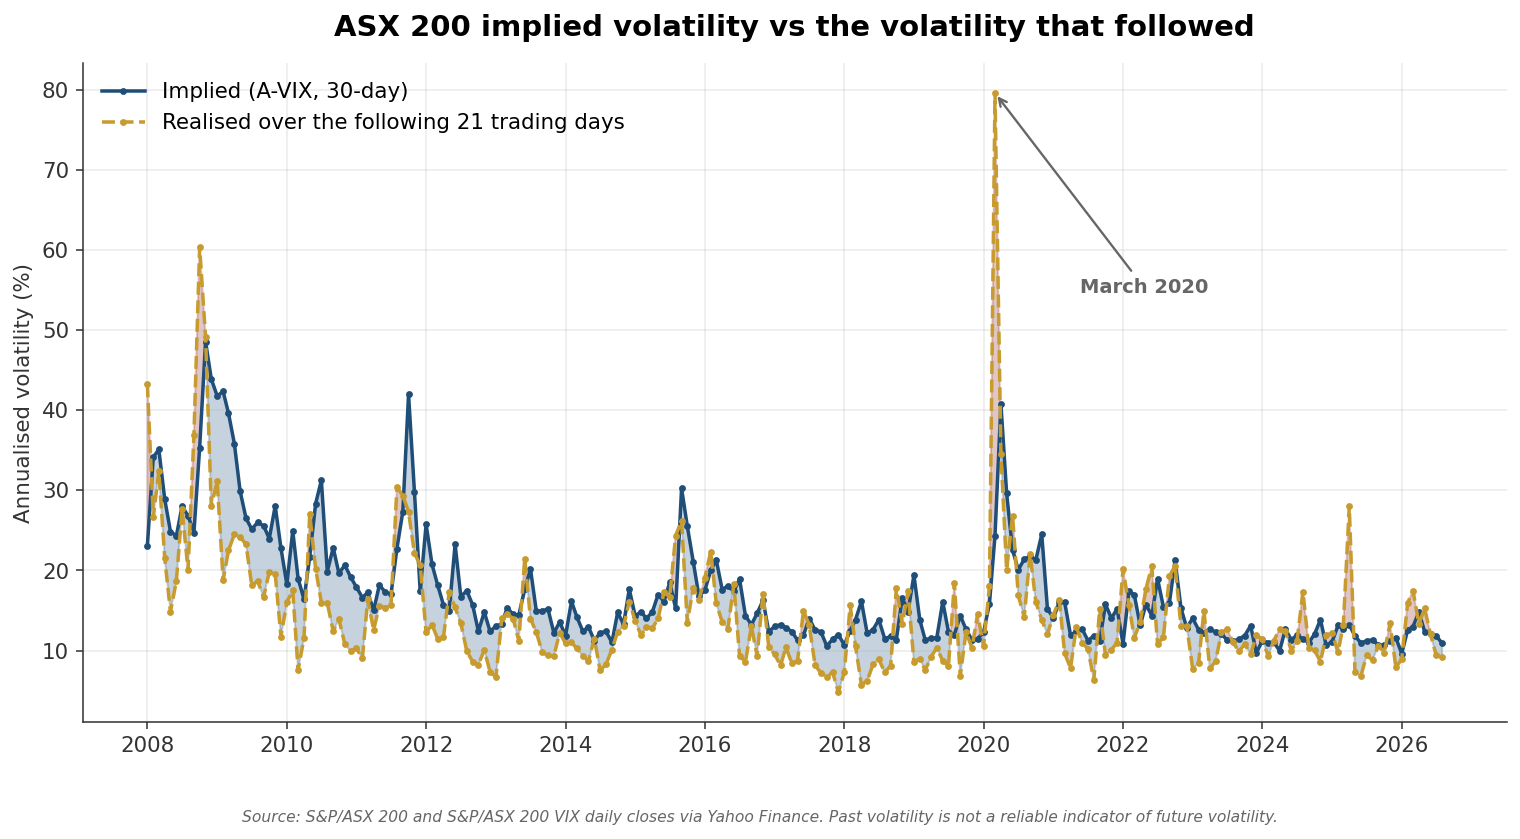
Implied sits above realised most of the time, and it sits a long way below it occasionally. Measured across every one of the 4,704 trading days from January 2008 to August 2026, implied volatility averaged 17.1 against 14.6 for the realised volatility that followed, an average gap of 2.43 volatility points, and implied was the higher of the two on 75.5 per cent of those days. The widest premium of any year in the record was 2009, the year after the crisis, when fear stayed priced into options long after the market itself had settled down.
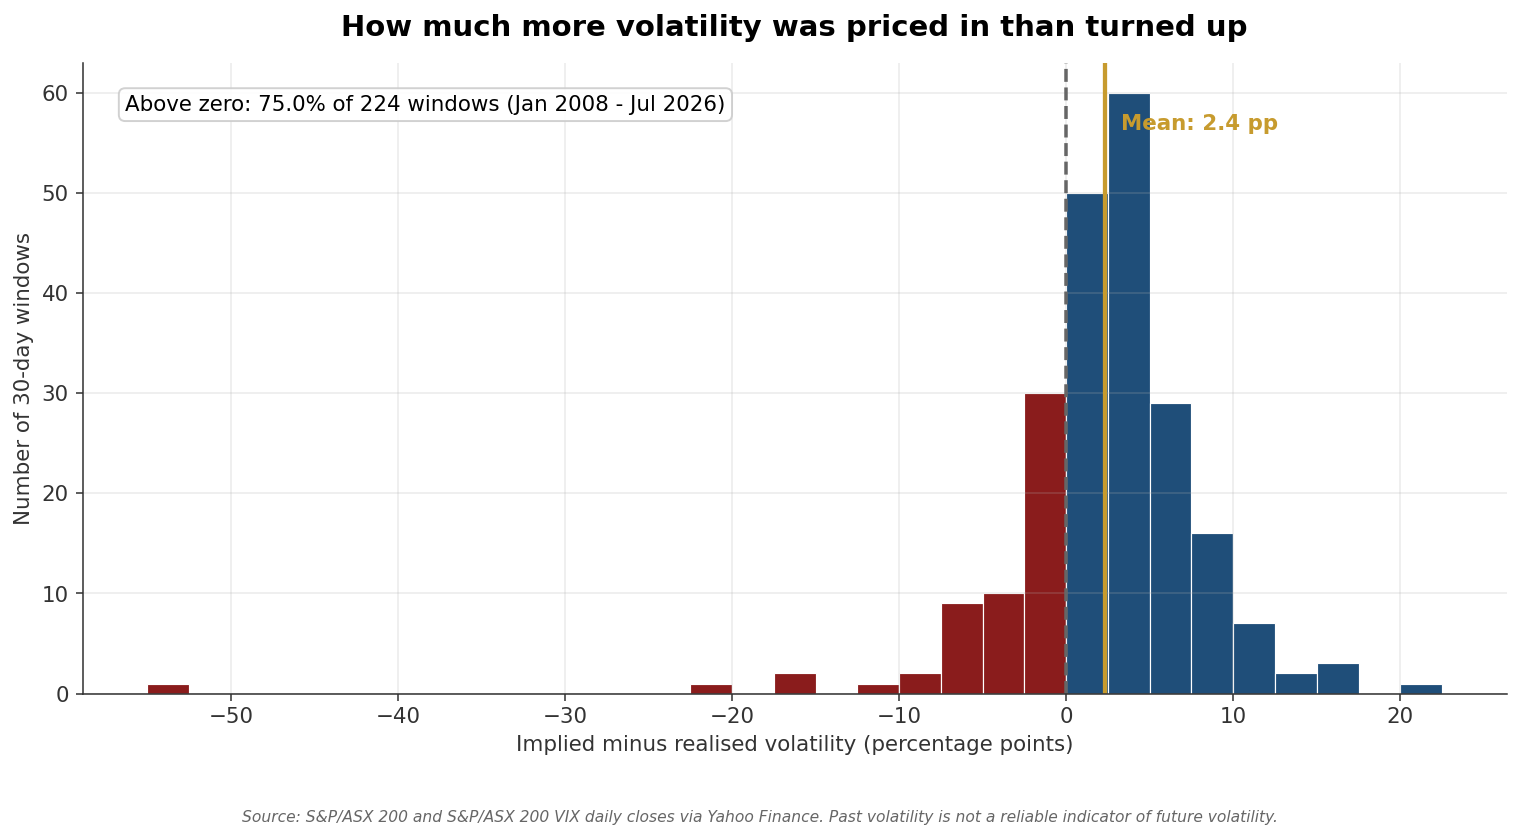
Counting each month once rather than every day separately gives the same answer, which is the check that matters. Splitting the record into non-overlapping windows produces a positive gap in between 73.7 and 76.8 per cent of windows depending on where the first window starts, and an average gap between 2.27 and 2.70 points. The result does not depend on how the data is cut.
That shape is the whole thesis in one picture, and the left tail is as important as the right. The premium exists because investors persistently pay above fair value for portfolio protection, which is a rational thing for them to do when the alternative is carrying the risk themselves. The seller on the other side collects that overpayment in most months and hands a large part of it back in the months when the market turns out to have been right to worry. Nothing guarantees the pattern continues, and the record above includes long stretches where the gap was much thinner than its average.
Delta neutral at entry
A position’s delta measures how much it moves when the index moves. The condor is constructed to start at roughly zero delta, which means that at the moment it is opened it is not a bet on the market rising or falling. Income is earned from the passage of time rather than from picking a direction, which is what makes the return stream structurally different from equity returns.
Neutral at entry is not the same as neutral for the life of the trade, and that distinction is where most of the work is. As the index moves, the position’s delta drifts, and a condor that started neutral quietly becomes a directional bet. Managing that drift is covered below.
Why Time Decay Matters
An option’s price has two parts, the intrinsic value and the time value. Time value is the amount a buyer pays for the possibility that the option finishes further in the money, and it goes to zero at expiry with certainty. For the buyer that is a cost of carry. For the seller it is the income.
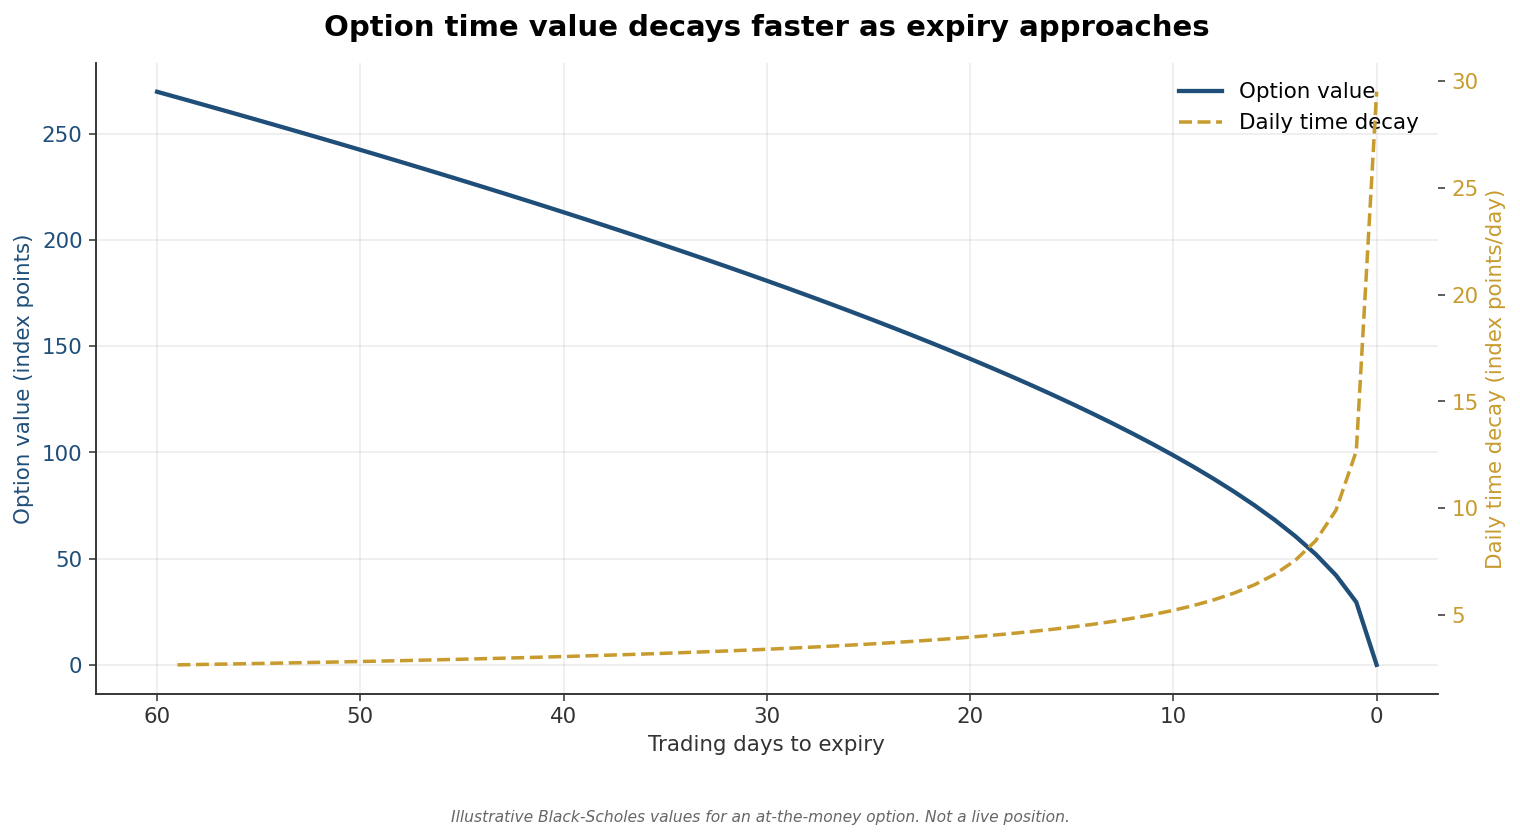
The important detail in that chart is the shape, not the level. Decay is not linear. It is slow at first and accelerates sharply into expiry, which is why the strategy works in defined cycles and does not simply sell the longest-dated option available. The same acceleration that pays the seller near expiry is also when the position becomes most sensitive to a sudden move, which is the gamma problem discussed in the risk section.
Decay is only collected if the index cooperates. Time value falling to zero is certain. Whether the index is inside the sold strikes when it gets there is not.
What the Index Actually Does
A range-based strategy is a bet on the ordinary behaviour of the index rather than on a forecast. So it is worth looking at what the ordinary behaviour has been.
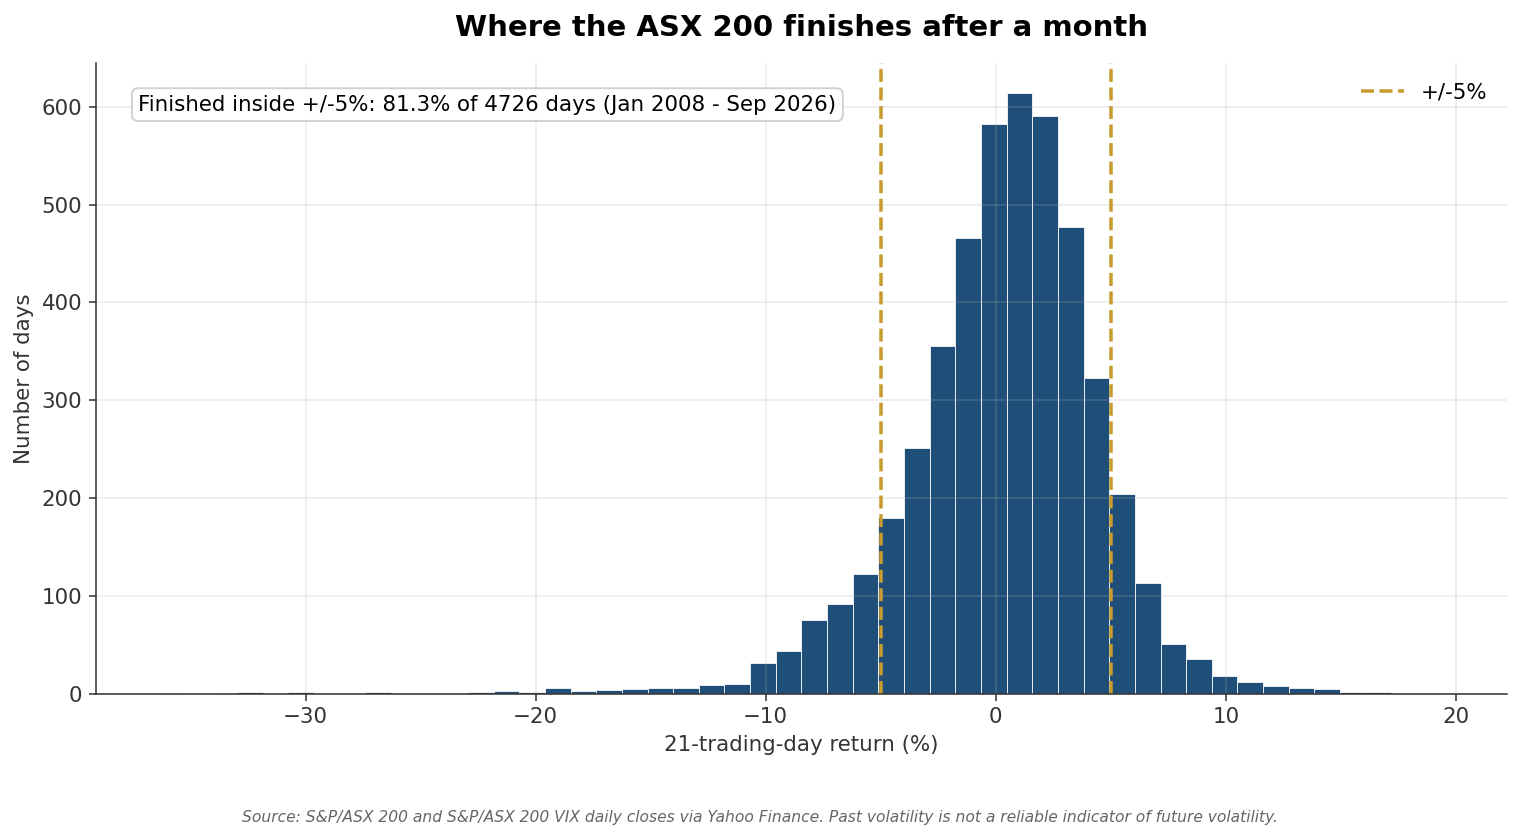
Over a 21-trading-day window, which is about the length of one options cycle, the ASX 200 finished within 5 per cent of where it started on 81.3 per cent of days since 2008, and within 3 per cent on 58.6 per cent of them. The median absolute move was 2.48 per cent. The index spends most of its time going not very far, which is the behaviour the strategy is designed to monetise. The tail on that distribution is also visible, and it is the reason the bought wings are part of the structure rather than an optional extra.
To step through the structure, the collateral arrangements, the account paperwork and how the signals reach you, book a callback with an MFAM adviser. How the strategy is delivered day to day is set out in How You Access the Strategy at the bottom of this page.
Request a CallbackPrefer to learn the fundamentals first? Access the free trading course.
Managing the Position After Entry
A structural edge on its own is not enough. The premium described above is available to anyone who sells an option, and most people who sell options do not keep it. What separates the outcomes is what happens between entry and expiry.
The strategy treats the position as something to be steered rather than held. As the index moves, the delta of the condor drifts away from neutral and the position starts to carry directional exposure that was never intended. The response is to adjust exposure before conditions compound, by rolling a threatened side, closing a leg, or reducing size, rather than waiting to see whether the index comes back. Position sizing is set so that a bad cycle is survivable rather than so that a good cycle is maximised.
This is an active, daily strategy. It is not a set-and-forget allocation, and it is not appropriate for capital that needs to be left alone.
Why Most Retail Attempts Fail
The iron condor is one of the best documented structures in the options literature. It is taught in most options courses, including free ones, and it is not a secret. It is also where a great many self-directed traders come unstuck, and in our experience the reason is not that the structure is flawed.
Options education typically stops at entry mechanics, which is the easy part. The strategy begins after entry. Four failure modes account for most of the damage.
The position starts neutral, the index moves, and the trader keeps thinking of it as a range trade while it has quietly become a directional bet.
Action is taken once the position is already hurting. By then the adjustment costs more than the premium the trade was opened for.
In the final weeks a small index move changes the position’s exposure very quickly. Size chosen for the calm part of the cycle is the wrong size for the end of it.
The fourth is not technical. Emotional decision-making overrides process during adverse periods, which is when process matters most. A trader who follows the rules for eleven cycles and abandons them in the twelfth has the results of the twelfth. Consistent execution across every position and every cycle is the difference between a strategy and a sequence of good trades interrupted by large losses.
When This Strategy Struggles
Selling premium has an asymmetric payoff shape by construction: a lot of small gains and an occasional large loss. Anyone considering it should understand the shape of the bad outcome before the good one.
The average premium described above is an average, and it is not evenly spread. Reading the same data year by year, the gap between implied and realised volatility was negative across 2020 as a whole, when realised volatility came in above what had been priced, and it has been slightly negative again across 2026 to date. The single worst window in the record starts on 5 March 2020. Options at that point were priced for 22.1 per cent annualised volatility, and the index went on to deliver 80.7 per cent over the following 30 days, a gap of 58.5 points the wrong way. In a window like that, an options seller pays out on positions opened at prices that looked generous at the time.
The two engines fall together
In a market-wide sell-off the share portfolio drops, the collateral value that portfolio provides drops with it, and the index moves down through the short put strikes on the options book. There is no diversification between the two engines when it matters most. A margin call in that environment arrives precisely when the collateral supporting it is worth less than it was.
Defined risk per position is not defined risk per portfolio
The maximum loss on any single iron condor is known at entry and is capped by the bought wings. That is a real feature, and it is not the same as a cap on what the strategy can lose. Several positions can reach their maximum loss in the same cycle, and a strategy that keeps selling every cycle is exposed again immediately after a bad one.
Gamma risk near expiry
The accelerating decay that pays the seller in the final weeks comes with accelerating sensitivity to index moves. Close to expiry, a modest move in the index can change the position’s exposure very quickly, which is why sizing and expiry management are not incidental details.
Liquidity and execution
XJO is a deep market by Australian standards, but it is not the S&P 500 options market. Spreads widen in stressed conditions, which is when adjustments are most needed, so the cost of getting out of a position is highest at the moment you most want to.
Concentration on the equity side
A portfolio concentrated mostly in the ASX top 20 is concentrated in banks and resources. That is a feature of the Australian market rather than a choice, and it means the equity engine carries real sector concentration.
Writing options can cost more than the premium received
Selling options creates an obligation, not just an opportunity to earn income. Losses on a written position can exceed the premium collected, and in a fast market can exceed it by a wide margin before the position can be adjusted. Margin obligations can increase without notice and can require additional cover at short notice. Options are not appropriate for all investors. Read the ASX options material and the relevant Product Disclosure Statement before trading, and get personal advice if you are unsure.
Strategy Characteristics
The $400,000 figure is not a regulatory minimum, it is a structural one. XJO contracts are sized at $10 per index point, so with the index near 8,800 a single contract carries roughly $88,000 of notional exposure. Below about $400,000 the strategy cannot size positions finely enough to keep any single cycle’s risk proportionate, and the margin cover the equity portfolio provides does not stretch far enough to run a properly diversified set of strikes.
Fees
The portfolio advice fee is charged monthly on the value of the portfolio, at $167 for every $100,000. On a $400,000 portfolio that is $668 a month, or $8,016 a year. Brokerage is charged on execution at $50 minimum or 0.5 per cent, whichever is greater, and applies to trades on both the equity and the options side. Exchange and clearing fees that the broker passes through sit outside those figures, as does tax, which depends on individual circumstances. Fee arrangements are confirmed in writing before any account is opened.
The structure, the collateral mechanics and the risks all reward a conversation rather than a web page. Book a callback and step through it with the adviser who runs the strategy.
Request a CallbackPrefer to learn the fundamentals first? Access the free trading course.
How You Access the Strategy
The strategy is delivered as non-discretionary general advice. MFAM generates the signals, and once you authorise each one, the MFAM adviser places the order on your behalf.
Your account, your custody
You open the account in your own name, with a broker that provides ASX equities and ASX Clear derivatives access. The shares, the cash and the options positions are all held in your account. MFAM does not hold, pool or control your funds at any point. The MFAM adviser is added to the account with trading authority only, so orders can be placed once you have authorised them, but money cannot be moved out of the account by MFAM. You can close the account or withdraw at any time without MFAM’s involvement.
General advice signals are issued as the strategy calls for them, covering entries, adjustments and closes. Each signal specifies the position, the strikes, the expiry and the size. Nothing is placed until you authorise it, and no response means no trade. Because the options book is actively managed, adjustments arrive during the life of a position as well as at entry, and each of those needs your authorisation too.
What non-discretionary means here
Every trade requires explicit authorisation before it is placed. The adviser does not have discretion to enter, adjust or exit positions without your instruction. This is general advice with client-authorised execution. It is not a managed account, not a managed discretionary account, and not a managed fund. You decide whether any given signal is actioned, and you can decline a signal or close a position at any time.
Collateral and margin
The equity portfolio is lodged with the clearing participant as cover against the margin obligations of the options book. Lodged shares are valued after a haircut, so the cover they provide is less than their market value, and both the haircut and the margin requirement can change as market conditions change. If the cover falls short, additional cash or securities are required at short notice. Which securities are acceptable, and on what terms, is determined by ASX Clear and the clearing participant, not by MFAM.
Your Adviser
e: etan@mfam.com.au
p: 1300 889 603
d: +61 (02) 8378 7129
m: 0411 693 922
Eason runs the Integrated Portfolio Strategy at MF & Co. Asset Management, covering both the Australian equity portfolio and the XJO options book that sits on top of it. He works with clients on the structure of the combined position, the collateral arrangements behind it, and the day-to-day management of the options cycle.
He is an Authorised Representative of MF & Co. Asset Management Pty Ltd (AFSL 520442) and provides general advice only.
You have seen the structure, where the income comes from, what the numbers behind it look like, and what a bad month does to it. The next step is a short conversation with Eason to walk through the account and collateral arrangements, sizing, and any questions on the strategy.
Request a CallbackWant the fundamentals first? Take the free 5-day trading course.
General Advice Warning
The information on this page is general advice only. It is general in nature and does not take into account your individual objectives, financial situation, or needs, and it is not personal financial advice. Before acting on any information presented here, you should consider its appropriateness having regard to your own circumstances, read our Financial Services Guide, and where relevant consider the Product Disclosure Statement for any financial product referred to. If you are unsure whether the strategy is right for you, seek personal advice.
No Performance Record Is Shown
This page presents no backtested, hypothetical or actual performance figures for the strategy, and no return, income or yield is projected, promised or implied. The charts and statistics on this page describe the historical behaviour of the S&P/ASX 200 and its options market. They are not a record of what any account has earned and they are not a forecast. Nothing on this page should be read as an indication of the returns the strategy has produced or will produce.
Market Data and Sources
Implied volatility figures are daily closes of the S&P/ASX 200 VIX (A-VIX) and index levels are daily closes of the S&P/ASX 200, both sourced from Yahoo Finance, covering January 2008 to September 2026, which is the full published history of the A-VIX index. Realised volatility is the annualised sample standard deviation of daily log returns over the 21 trading days following each observation. Twenty-one trading days is used as the working equivalent of the 30 calendar days the A-VIX measures, and the two horizons are close but not identical. The headline implied-versus-realised statistics are calculated across all 4,704 trading days on which both figures are available, so those windows overlap. The robustness figures quoted alongside them, and the distribution chart, instead use non-overlapping windows taken end to end, reported across all 21 possible starting offsets. Past volatility is not a reliable indicator of future volatility. The iron condor payoff and time decay charts are illustrative constructions, not live positions, and the time decay chart uses Black-Scholes values for an at-the-money option.
Options Risk
Writing options involves significant risk. Losses on a written option position can exceed the premium received and can exceed the amount initially committed to the position. Margin obligations can increase at short notice and may require additional cash or securities to be lodged. Adverse market conditions can make positions difficult or costly to close. The maximum loss on an individual defined-risk position is capped by its bought protection, which does not cap the loss the strategy as a whole can incur across multiple positions or successive cycles. Options are not appropriate for all investors. You should read the relevant Product Disclosure Statement and consider obtaining personal advice before trading options.
Collateral and Margin
Securities lodged as collateral with ASX Clear are valued after a haircut, so the cover provided is less than market value. Both the haircut and the margin requirement can change with market conditions. A fall in the value of the lodged portfolio reduces available cover at the same time as market stress is likely to increase the margin required. Which securities are acceptable as cover is determined by ASX Clear and the clearing participant, and is subject to change. Lodged securities are exposed to the obligations of the options positions they support.
Correlation Between the Two Engines
The equity portfolio and the options strategy are not independent sources of return. A broad market decline reduces the value of the share portfolio, reduces the collateral it provides, and moves the index against the sold put positions at the same time. The combination should be considered as a single exposure to the Australian share market rather than as two diversified ones.
Fees
The portfolio advice fee is $167 per $100,000 of portfolio value per month, which is approximately 2 per cent per annum. Brokerage is charged on execution at $50 minimum or 0.5 per cent, whichever is greater. Exchange, clearing and regulatory fees passed through by the broker sit outside those figures. Tax, including the treatment of franking credits and of gains and losses on options positions, depends on individual circumstances and is not modelled anywhere on this page. Fee arrangements are confirmed in writing before an account is opened.
No Guarantee
MF & Co. Asset Management makes no representation or guarantee regarding the future performance of the strategy. Returns may be negative. You may lose capital.
About MFAM
MF & Co. Asset Management Pty Ltd (ABN 99 622 929 597) holds Australian Financial Services Licence (AFSL) 520442, authorising it to provide general financial product advice and to deal in financial products including derivatives traded on a licensed market. MFAM is not authorised to provide personal financial advice. Eason Tan is an Authorised Representative (AR 001320227) of MF & Co. Asset Management. This page has been prepared for general information purposes.