
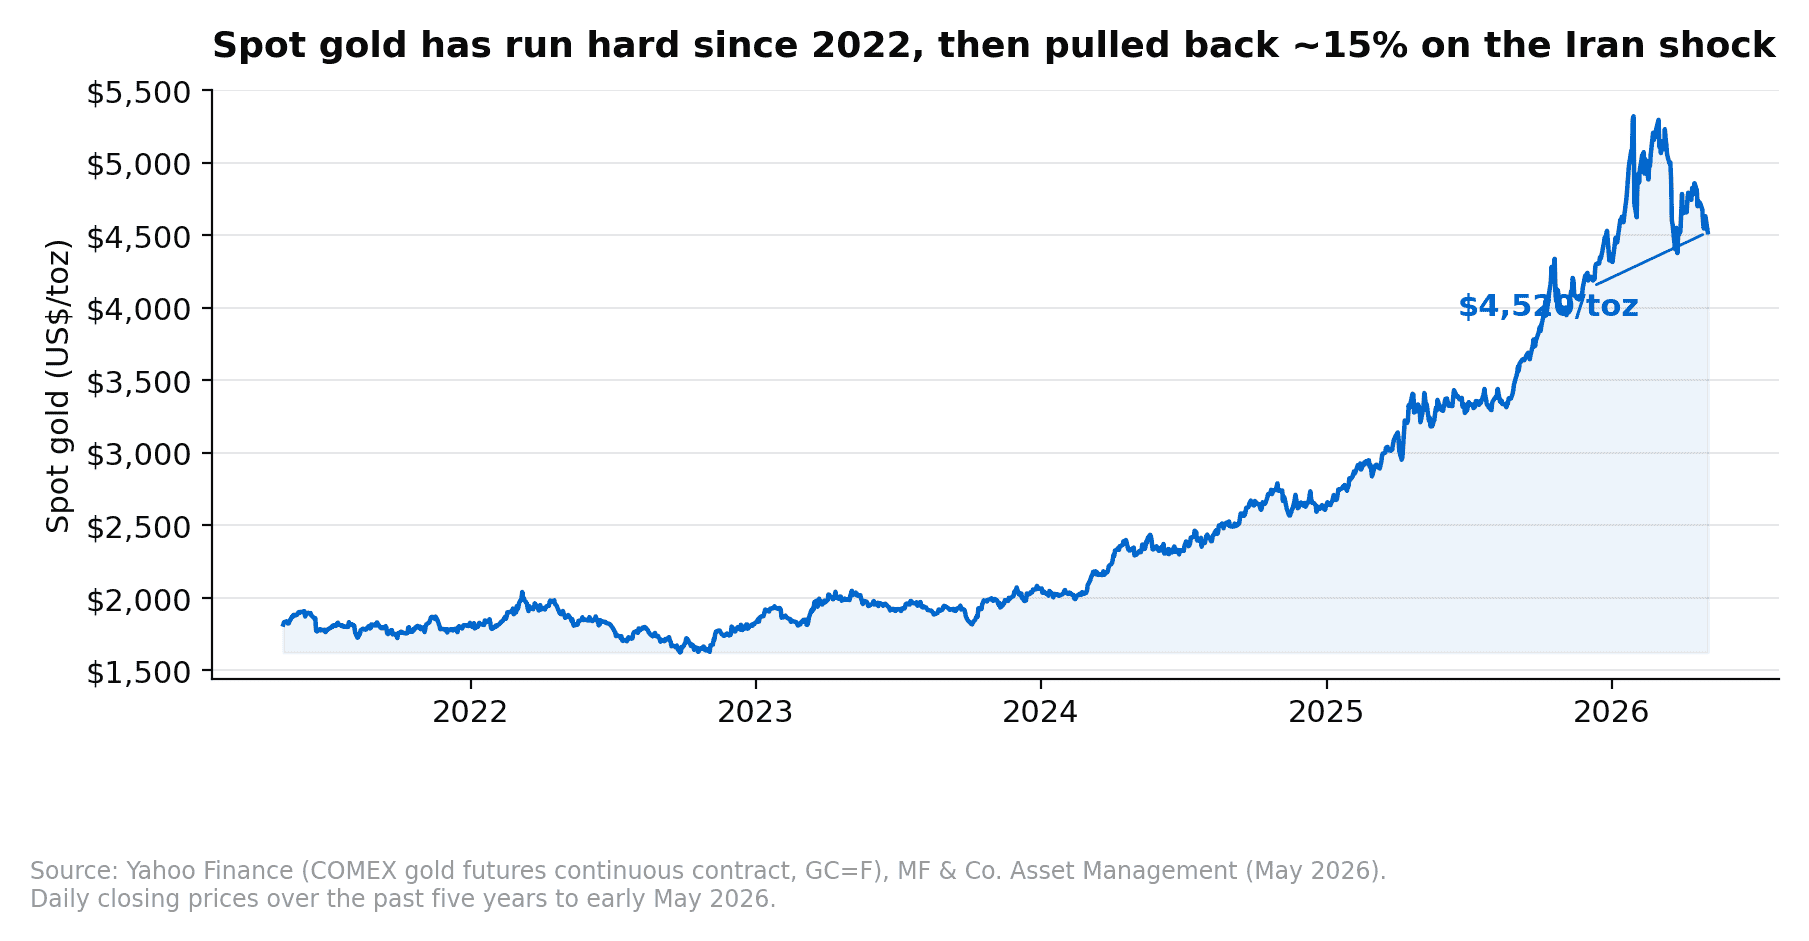
Gold has had a turbulent few months. Spot gold ran from around US$3,400/toz at the end of 2025 to a peak above US$5,300/toz in early 2026 on a wave of speculative call-option demand and continued central bank diversification. The Iran shock in late March then triggered a roughly 15% pullback to around US$4,520/toz, as the supply-driven inflation impulse pushed markets to reprice the Fed path toward fewer cuts and gold-positioning was forced to clear. Institutional sell-side commentary remains structurally bullish, with the medium-term base case looks for gold to settle around US$5,400/toz by the end of 2026, anchored by continued central bank buying, a normalising speculative position, and the Fed cutting cycle expected to deliver around 50 basis points of easing this year. Near-term risks skew to the downside if Hormuz disruption persists, but the medium-term risks skew to the upside if private sector diversification accelerates from a still-very-low base.
Last updated: 28 April 2026. Sector outlook refreshed when new sell-side notes or material market moves warrant, not on a fixed cadence.
Table of Contents
The Setup Today
Spot gold sits around US$4,520/toz at time of writing, having sold off roughly 15% from the early-2026 peak above US$5,300. The pullback has cleared most of the speculative overhang that built up through January and February, with net speculative positioning on Comex sits around the 40th percentile of its multi-year range, and the call-option positioning on GLD that was driving dealer-gamma amplification has been largely unwound. The market looks materially cleaner than it did at the peak, and the structural drivers behind the multi-year run higher are still in place.
Three things are different about this gold cycle compared with the 2011-2019 grind. First, central bank demand has stepped up to a structurally higher level. Second, retail and institutional ETF gold holdings are still very low as a share of total portfolios. Third, the freezing of Russia’s reserves in early 2022 changed how reserve managers think about counter-party and jurisdictional risk, accelerating an EM-led diversification into gold that has not yet fully played out.
Why Central Banks Are Still Buying
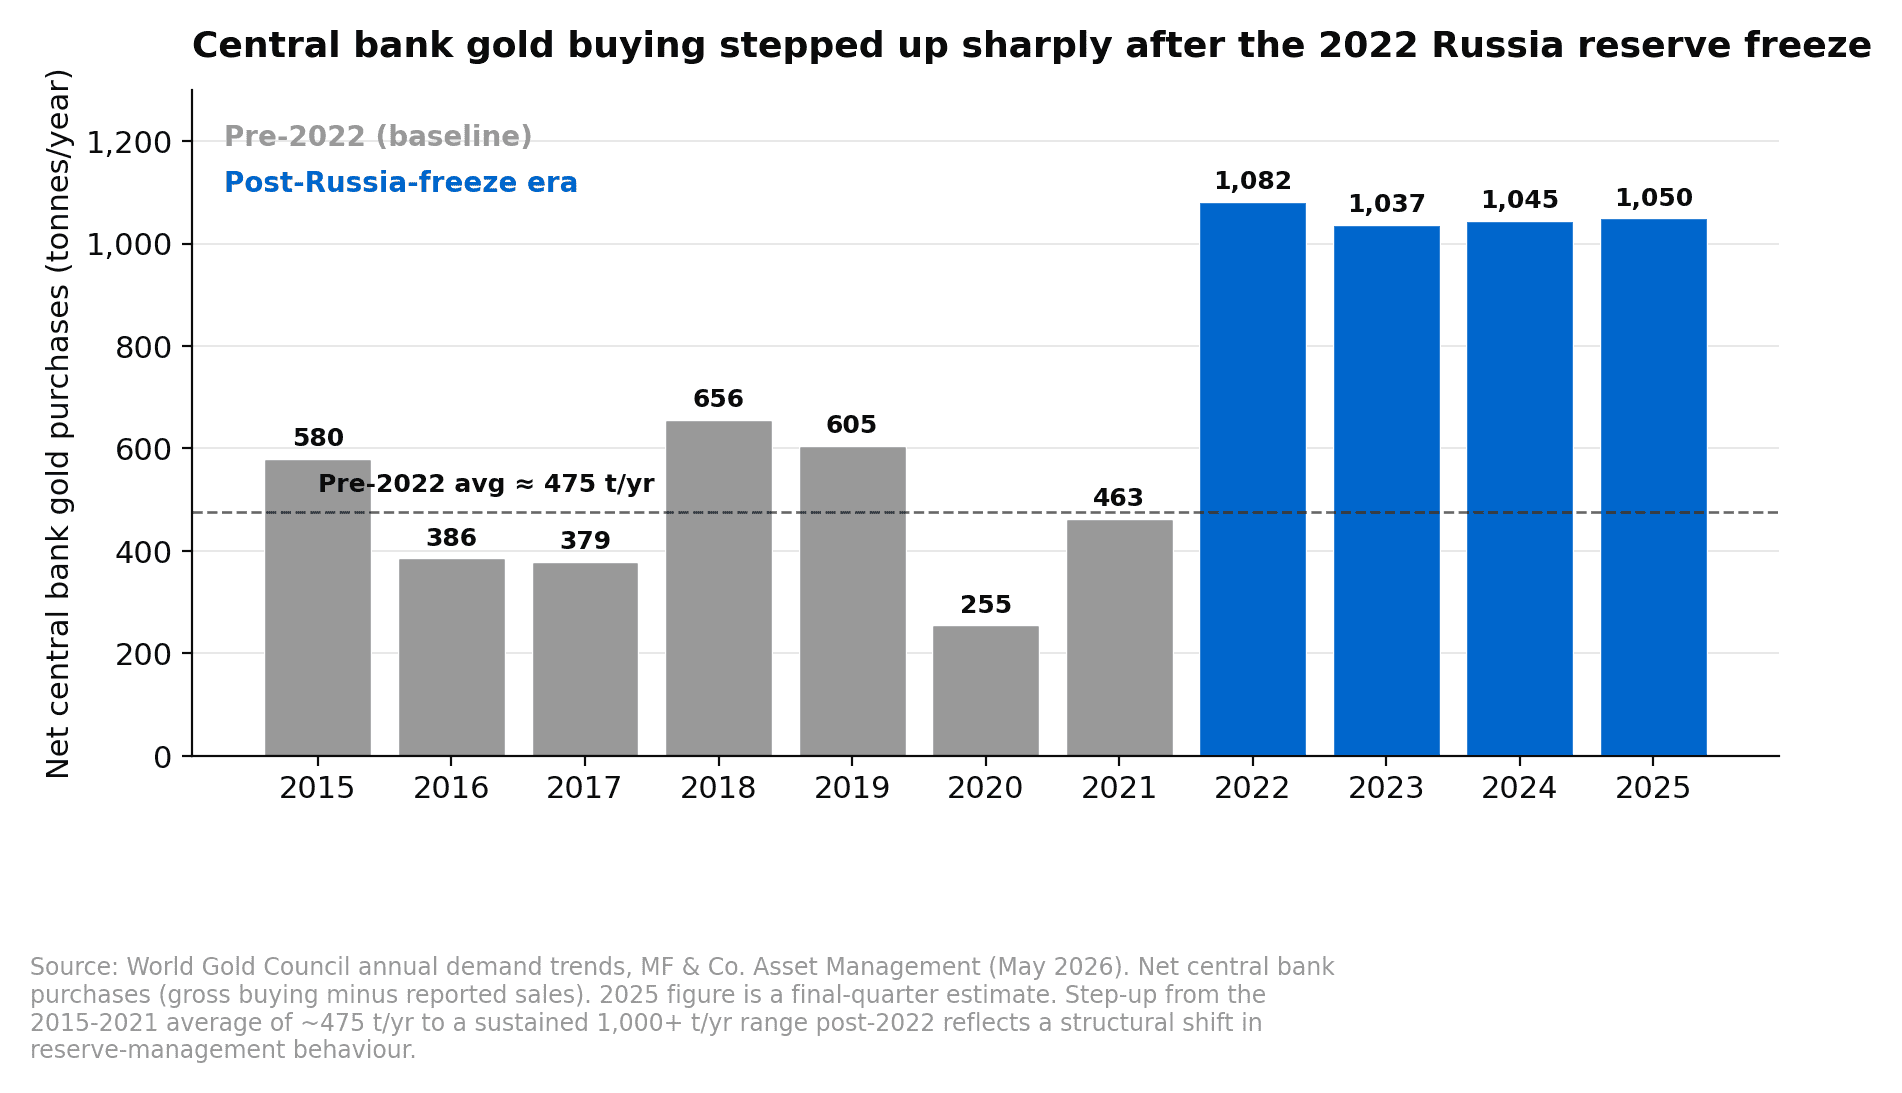
The clearest structural support for the gold price is what central banks have been doing since 2022. Net central bank gold purchases averaged around 475 tonnes per year over 2015-2021. Since 2022, that has stepped up to a sustained 1,000+ tonnes per year, roughly double the pre-Russia-freeze pace. The 2022 freeze of Russia’s foreign reserves was a wake-up call for any central bank holding US-dollar-denominated assets and worried about geopolitical alignment with Washington. The result has been a steady reallocation by EM central banks into gold, which sits outside any single jurisdiction and cannot be frozen by another government.
The institutional view is that this is a multi-year, possibly multi-decade reallocation. Surveys of central bank reserve managers conducted at industry conferences earlier in 2026 had around 70% of respondents expecting global gold reserves to keep rising over the next 12 months, and around 70% expecting gold prices to settle above US$5,000/toz over the same horizon. EM central banks remain structurally underweight gold relative to where reserve theory and geopolitical-risk hedging would put their target allocations. China, India, and several Gulf-state central banks all sit well below the gold weights that the larger advanced-economy central banks have held for decades.
There was a soft patch in central bank buying through the early months of 2026, with the monthly nowcast slowing to single-digit tonnes through January and February. The institutional read on this slowdown is that it is temporary, driven by the elevated price volatility that came with the call-option-led private-sector buying, which made central banks reluctant to chase the price higher. As volatility moderates, the expectation is that central bank buying re-accelerates back toward the 50-60 tonnes per month range that has held for most of the post-2022 era.
What Anchors the Constructive View
The institutional base case for gold settling around US$5,400/toz by end-2026 rests on three independent supports rather than a single thesis. The first is positioning. Net speculative positioning on Comex has fallen to around the 40th percentile of its multi-year range after the Iran-shock liquidation, and simply rebuilding to the historical median represents incremental demand without anything fundamental needing to change.
The second support is the real-rate channel. The Fed easing cycle expected through 2026 means lower nominal rates without proportionally lower inflation expectations, which historically correlates strongly with gold price appreciation. Even after the hawkish repricing that followed the Iran shock, the institutional consensus still has around 50 basis points of cuts coming this year.
The third is central bank demand re-accelerating off its early-2026 soft patch. Once price volatility moderates, the central bank flow that slowed through January and February should return to its post-2022 baseline of 50-60 tonnes per month. Central bank buying is the largest single demand component of the structural bullish case, and recent reserve-manager surveys point to it continuing to compound for years.
What This Means for Gold Miners
Gold miners trade as a leveraged play on the gold price. The mechanics are simple. A producer’s all-in sustaining cost (AISC) is largely fixed in the short term, so when the gold price moves higher, almost the entire incremental revenue drops to operating earnings. A miner with US$1,500/toz AISC selling gold at US$3,000/toz earns a US$1,500/toz margin. If gold rises another 20% to US$3,600/toz, the margin grows to US$2,100/toz, a 40% increase in profit per ounce on a 20% move in the underlying. That operational leverage is what makes mining equities outperform gold itself in rising markets, and underperform in falling ones.
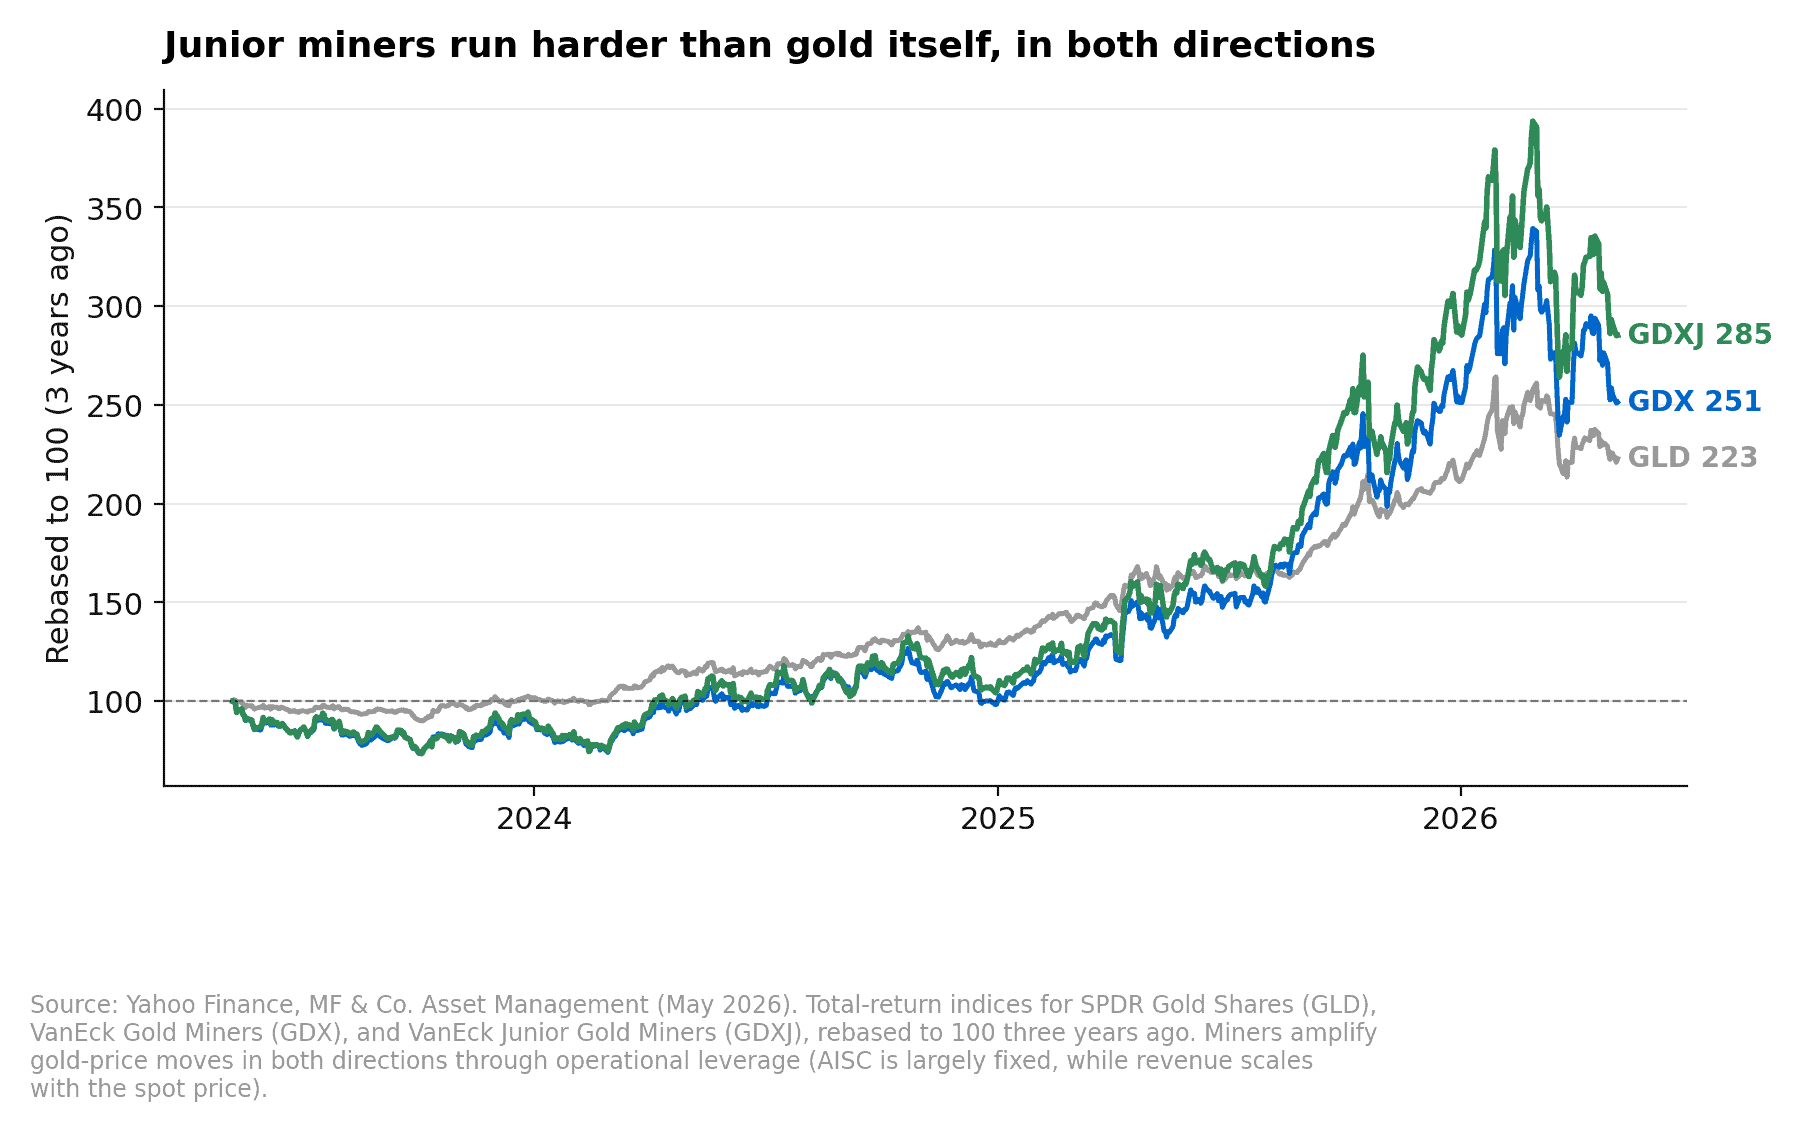
The leverage is more pronounced in the junior miner tier (small and mid-cap producers and explorers, captured by GDXJ) than in the senior tier (the large diversified producers in GDX). Juniors carry higher AISC, more single-mine concentration, and larger operational gearing to gold. Over the past three years, while spot gold has roughly doubled, GDX has risen around 150% and GDXJ around 185%, as the rebased chart above shows. The the rebased chart above. The relationship is not linear, and the juniors carry meaningfully more drawdown risk in gold pullbacks, but the leverage works in both directions.
The 2024-2025 gold rally has flowed through to mining equities, but the sector still trades at lower valuation multiples than its multi-year averages, partly because retail flows into mining-equity ETFs have lagged the recovery in spot gold. If the institutional base case plays out and gold continues to grind higher, miners would be expected to translate that into a steeper move on the upside.
Free 5-day email course
Learn how we build and run systematic trading strategies
One short lesson per day on how rules-based strategies are framed, sized, and run live, drawn from the same playbook MFAM uses on its own systematic trading desk. No commitment, unsubscribe at any time.

Taught by Henry Fung
Founding Partner, MF & Co. Asset Management · AFSL 520442 · RG146, ADA1, ADA2 · Bachelor of Business & Accounting · 20+ years experience
Near-Term Risks
Despite the structural bull case being intact, the near-term risk picture skews to the downside.
The first risk is that Hormuz disruption persists longer than energy markets currently expect. A sustained energy supply shock would push the inflation impulse harder and force markets to price in even fewer Fed cuts, which would weigh on gold via higher real rates and trigger another wave of margin-related liquidation. The lower bound of any such liquidation, in a stress scenario where investors fully unwind the macro-policy hedges built up since early 2025, is estimated at around US$3,800/toz, implying perhaps another 15-20% downside from current levels. This is viewed as unlikely by the institutional sell-side base case, but it defines the worst-case range.
The second risk is mechanical. Call option demand on GLD has been rebuilding off the late-January washout and is again running near record levels. When dealers are short calls and the price falls, hedging dynamics flip from buying-into-strength to selling-into-weakness. A relatively modest catalyst (a mild equity correction, an incremental geopolitical de-escalation) can trigger a larger-than-usual pullback through gamma-driven dealer flows. The lower bound of such pullbacks is around US$4,700/toz on the institutional view, with a “buy-the-dip” expectation that any move that low would be short-lived given pent-up demand from investors looking to add gold exposure.
The third risk is more idiosyncratic. Reports earlier in 2026 of central bank gold sales by Turkey (around 52 tonnes) raised concerns about Gulf-state central banks following suit. The institutional read is that this is unlikely, since Gulf central banks hold meaningfully lower gold shares in their reserves than Turkey did and are more likely to draw on US Treasury holdings than gold for FX-management purposes. But the risk is non-zero, and a confirmed second wave of central bank selling would force a re-rating of the structural bullish thesis.
The Upside Scenario
If the Iran episode and broader geopolitical developments accelerate private sector diversification away from traditional Western assets. If perceptions of Western fiscal sustainability deteriorate, or if defence-spending levels are revised structurally higher and put further pressure on long-end yields, the upside to gold prices could be substantial.
The arithmetic on the upside is non-linear. ETF gold holdings represent only around 0.2% of US private sector portfolios, an order of magnitude below historical highs. Each one basis point of incremental private sector portfolio allocation to gold corresponds, on the institutional sell-side framework, to roughly a 1.5% move higher in the gold price. Even modest reallocation by US private investors, say from 0.2% from 0.2% to 0.5% of portfolio, would represent meaningful upside above the US$5,400 base case. A more aggressive scenario where macro-policy hedging rebuilds toward pre-selloff levels would put gold closer to US$5,700/toz, and a continuation of the pre-Iran trend in private buying could carry prices toward US$6,100/toz.
Tools for Gold Exposure
For investors who want to express a constructive view on gold, the ETF universe is well-developed and offers several distinct ways to participate.
The cleanest way to take pure gold price exposure is via GLD, the SPDR Gold Shares ETF, which holds physical gold in vault and tracks the spot price net of expense ratio. IAU from iShares offers similar exposure at a lower fee. Both are cash-like proxies for the underlying metal, useful for investors who simply want gold’s diversification properties in a portfolio without the storage and counter-party complexity of holding physical bullion.
For exposure to the senior gold miners, GDX from VanEck holds the largest diversified producers globally including Newmont, Barrick, and Agnico Eagle. It gives leveraged exposure to gold via mining-equity operational gearing, with lower volatility and lower drawdown risk than the junior tier because of scale, geographic diversification, and stronger balance sheets.
One step further out the risk curve sits GDXJ, the VanEck Junior Gold Miners ETF, which holds small and mid-cap producers and explorers. The juniors amplify gold price moves more sharply in both directions, so for investors who want maximum participation in a sustained rally and are willing to wear the additional drawdown risk in pullbacks they are the cleanest expression. RING from iShares is an alternative gold-miner basket with a slightly different weighting scheme.
The tactical tier sits in the leveraged gold-miner ETFs, JNUG (2x daily long junior miners) and NUGT (2x daily long senior miners). These are designed for daily directional positioning, and the daily-reset structure means volatility decay accumulates over multi-day holding periods, so they are appropriate inside a defined trading framework with explicit entry, sizing, and exit rules rather than long-term buy-and-hold positions.
If running a defined tactical or systematic strategy is new territory, our free five-day course on systematic trading walks through how we frame entry, sizing, exit, and risk in our own systems. It is delivered over email with no commitment, and is the simplest way to see how a framework like this actually comes together in practice before deploying capital into the leveraged tier.
If you would like to discuss how exposure to gold or gold miners might fit within your portfolio, request a callback or call us on 1300 889 603. We are happy to talk through the trade-offs between holding the metal directly via GLD or IAU, taking the leveraged exposure via miners, or running a defined tactical position via the leveraged-ETF tier.
ETF Universe
The full ETF universe MFAM references for gold and gold-miner exposure:
- GLD, the SPDR Gold Shares ETF, gives 1x long physical gold exposure with deep liquidity.
- IAU, the iShares Gold Trust, also gives 1x long physical gold exposure at a lower fee than GLD.
- GDX, the VanEck Gold Miners ETF, gives 1x long exposure to a basket of senior gold producers.
- GDXJ, the VanEck Junior Gold Miners ETF, gives 1x long exposure to junior miners and explorers.
- NUGT, the Direxion Daily Gold Miners Bull 2X, gives 2x daily long exposure to senior miners and is a tactical instrument
- JNUG, the Direxion Daily Junior Gold Miners Bull 2X, gives 2x daily long exposure to junior miners and is a tactical instrument
Note: Leveraged ETFs are designed for daily directional exposure and exhibit volatility decay over multi-day holding periods. They are appropriate inside a systematic or tactical trading framework with defined entry, sizing, and exit rules, not as buy-and-hold instruments. Past performance is not a reliable indicator of future performance, and any investment carries risk of loss of capital.