
The Reserve Bank lifted the cash rate 25 basis points to 4.35 percent on Tuesday, the third hike of the year, and Michele Bullock told the press conference that the door remains open to more. Markets repriced into one further hike by August. The decision lands at the same time as a fresh G10 consumer dashboard that puts the Australian household at the bottom of the developed-market table on real spending growth, before this week’s hike has even hit a single mortgage repayment. That is the picture this piece works through.
Published 8 May 2026.
Where Australia Sits in the Global Picture
The major investment banks publish quarterly G10 consumer scorecards that rank each country across seven indicators of consumer state, real spending growth, real income growth, the unemployment gap, consumer confidence, debt service ratio, net-worth-to-income, and real net worth growth, and convert each to a percentile rank since 2000. A weighted average of those seven is the quick read on overall consumer health. The April update dropped this week.
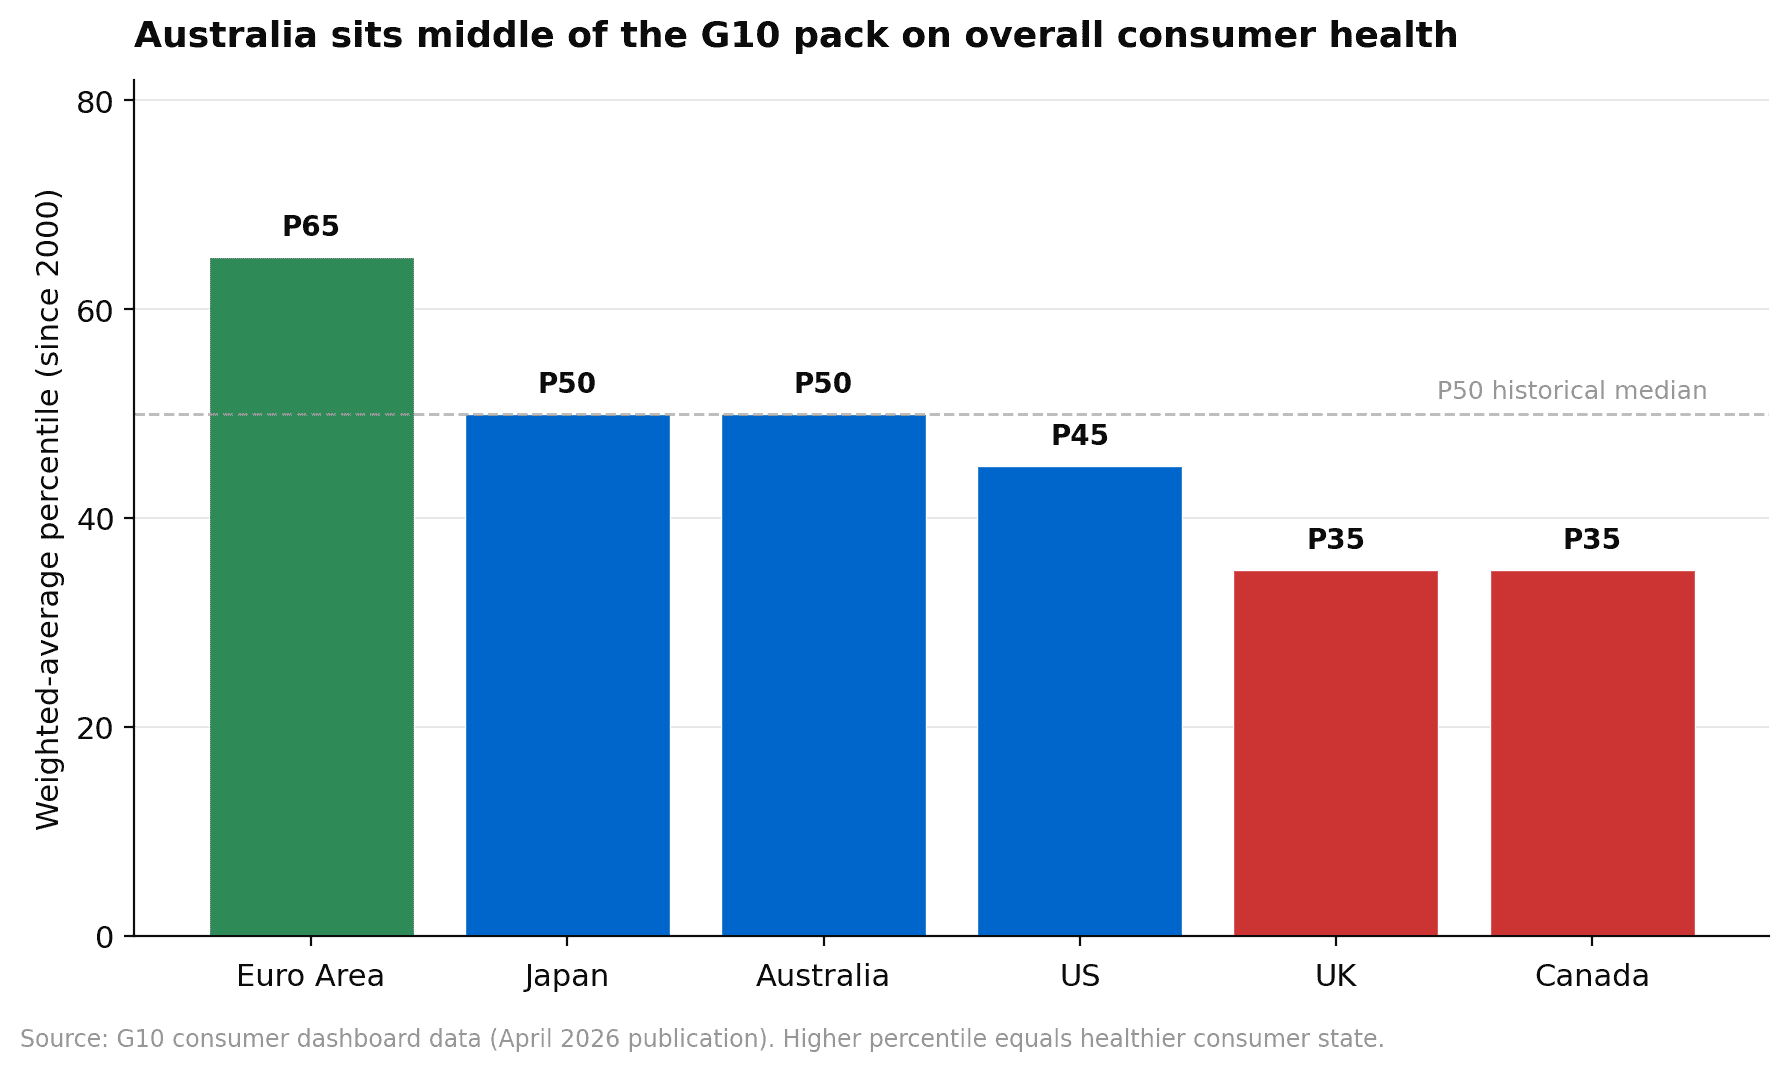
Australia comes in at P50, the historical median, sitting alongside Japan in the middle of the pack. The Euro Area is the cleanest read at P65, helped by a tight labour market and net worth that has rebuilt through 2025. The US is at P45 and slipping. The UK and Canada are the sick patients at P35, with the UK on weak real wage growth and Canada on a property cycle that is still grinding lower.
That middle-of-the-pack overall read is the wrong number to anchor on. It hides a split inside the Australian dashboard that matters far more for portfolio decisions than the headline rank does.
Australia’s Split Personality
The seven indicators do not move together for Australia. They split cleanly into two groups.
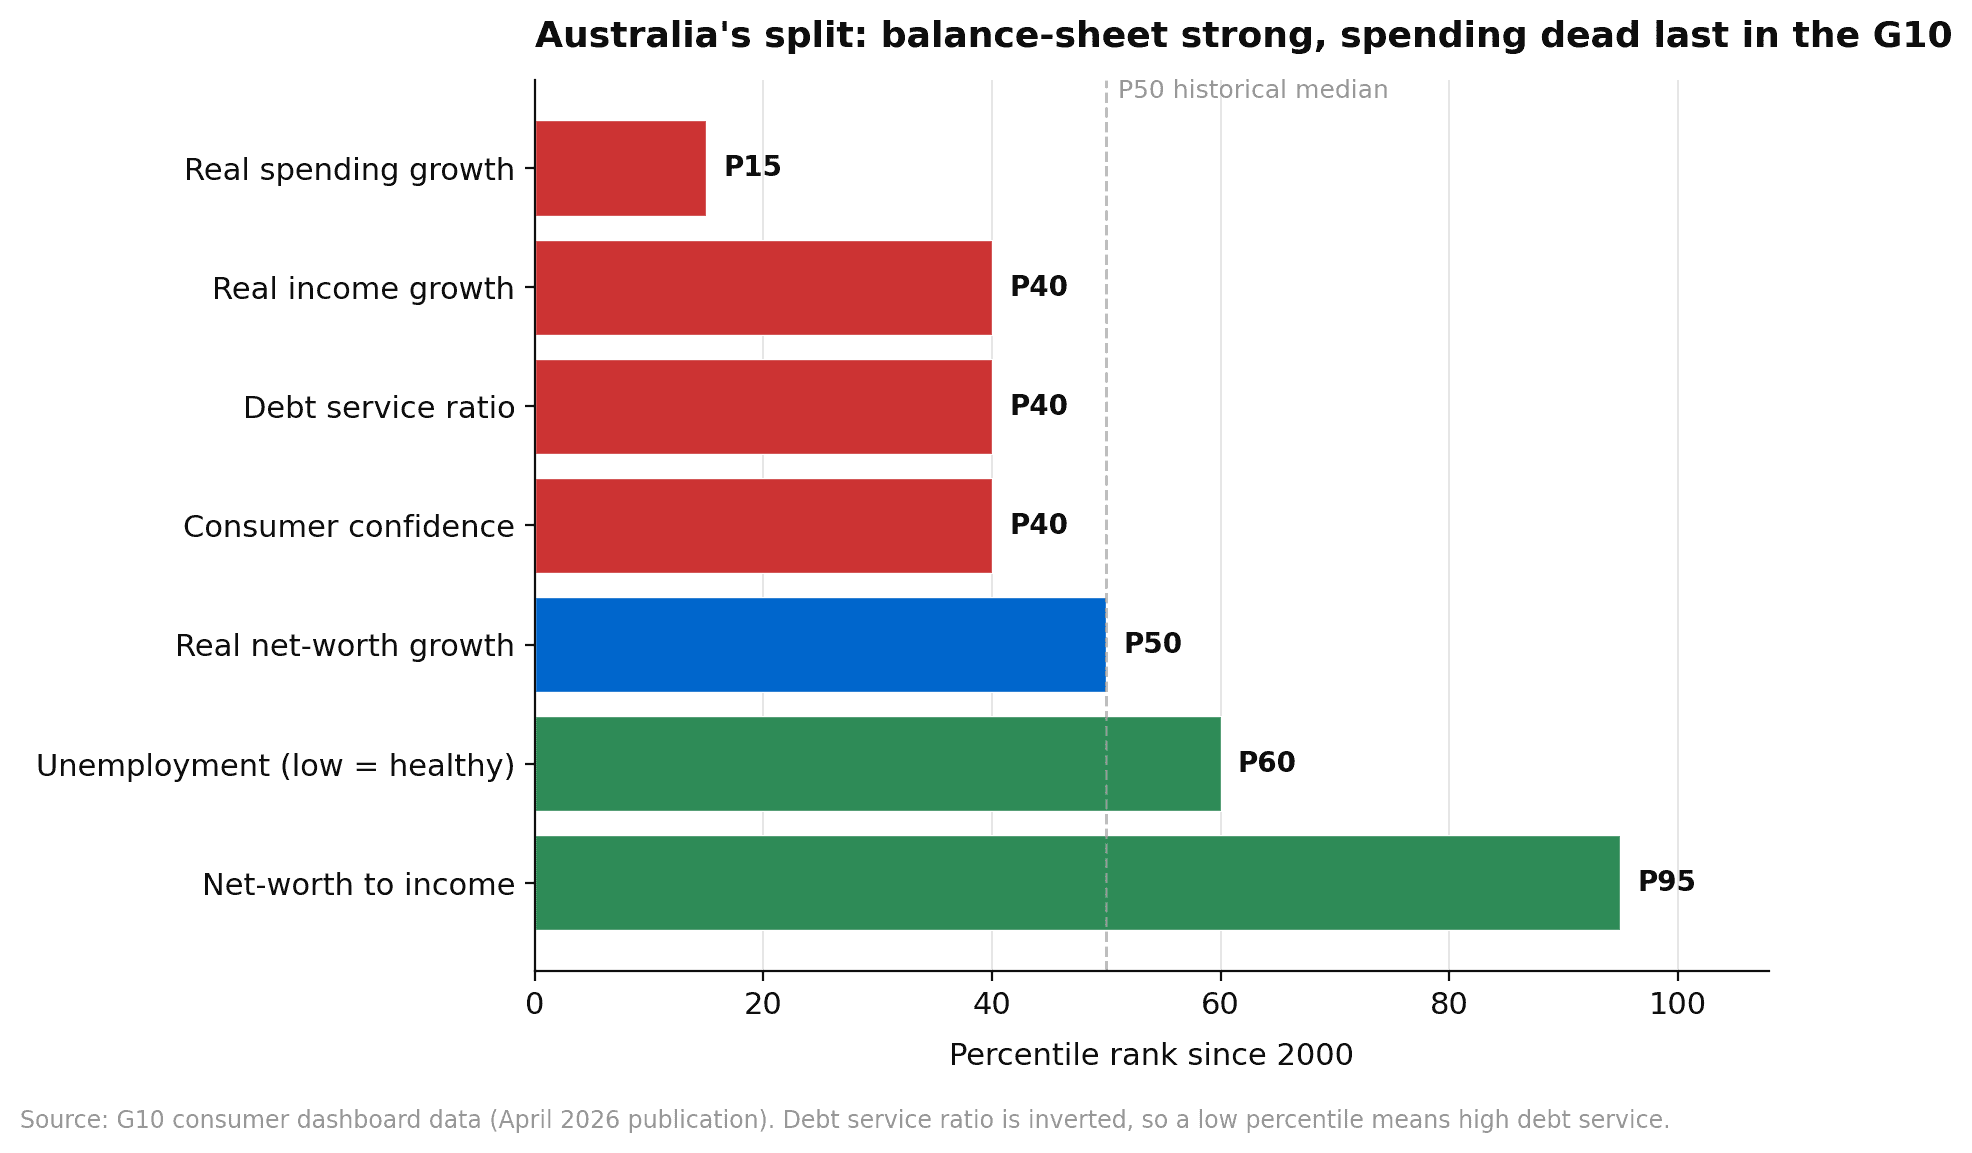
The healthy half is exactly what you would expect from the country with the strongest house-price recovery and the tightest labour market in the cohort. Net-worth-to-income sits at P95, near a record. Real net worth growth is at P50. The unemployment gap is at P60, with the published rate at 4.3 percent and still well below the decade average. On those three measures Australia is doing fine.
The unhealthy half is the part that matters for the next two quarters. Real spending growth sits at P15, the lowest reading anywhere in the G10. Real income growth is at P40 and softening. Consumer confidence is at P40. The debt service ratio is at P40 on the dashboard’s inverted scale, which translates to actual interest costs as a share of disposable income that are elevated relative to their own twenty-five-year history. Only Canadian households are paying more interest as a share of income.
Read those two halves together and the picture is straightforward. Australians own assets that look fine on paper. They are paying down mortgages out of income that is barely growing in real terms, and the rising interest bill is showing up in the spending data. The wealth is real but it is not financing consumption.
What the May Hike Adds
Tuesday’s hike was a 25 basis-point move, of which the standard variable rate pass-through is roughly two thirds within sixty days and the rest within ninety. For the median Australian mortgage, that is around fifty to seventy dollars a month of additional debt service starting in June.
That sounds small. The pattern matters more than the number. This is the third hike of the year. The cumulative debt service drag from January to now is roughly two hundred dollars a month for the same median borrower. Two hundred dollars a month, taken out of income that is growing at roughly the rate of headline inflation, is the mechanism by which spending growth went from above the post-pandemic average in late 2024 to dead last in the G10 by April. Tuesday’s hike continues that mechanism rather than reversing it.
The dashboard read on debt service was P40 with current data through February. By the August dashboard, after May and one or two more hikes flow through, that number is heading for P30 or lower. That puts Australia level with Canada on debt service, which would be the worst position in the G10.
What’s Happening Globally
Three things are worth pulling out of the cross-country picture, because they shape what offshore demand looks like for the Australian businesses with revenue exposure outside the country.
The US consumer is fragile in sentiment but resilient in spending. Personal spending grew 0.9 percent in nominal terms in March but only 0.2 percent in real terms, the slowest pace in four months. The University of Michigan consumer sentiment index went to its lowest preliminary April reading in the series history. Sentiment that low and spending that soft tells you the next print is more likely to fall than to rebound, particularly with the energy effects from the Middle East still working through to retail prices.
The UK and Euro Area split. UK retail sales are picking up off a depressed base while Euro Area retail sales remain subdued, but the Euro Area entered the period from a much healthier starting point. Both economies still have spending roughly five to ten percent below the pre-pandemic trend on goods, and a flat trend on services. Translation: any business with European revenue exposure is operating in a structurally lower-volume environment than the pre-2020 plan assumed.
Japan and Canada are the soft spots. Japanese consumer confidence saw the largest negative move in the cross-country sample. Canadian household debt service is at P25 and falling, which is the direct read on why housing is still in train-wreck mode there. Neither country offers a tailwind to global retailers operating across borders.
Major investment banks have flagged the same pattern: developed-market consumer health deteriorates further over the next two quarters as energy headwinds from the Middle East feed through to inflation and activity. The cross-country data is consistent with that read.
What This Means For An Australian Portfolio
Domestic discretionary retail is the most exposed leg of the local market. Wesfarmers, Harvey Norman, JB Hi-Fi, Premier Investments, and Myer all report into a consumer that has now produced four straight months of real spending growth at or near the bottom of the G10. The cleaner names in the sector are the ones whose customer base does not feel the cash rate move directly, which means consumer staples take share from discretionary in this kind of environment. Coles and Woolworths benefit from trade-down, particularly in own-brand categories. The supermarkets are not exciting at current valuations but the earnings risk is meaningfully lower than for the discretionary names.
Banks remain a near-term winner from the rate path itself. Net interest margins widen mechanically when the cash rate steps up ahead of deposit repricing, and that is a four-to-six month tailwind to earnings. The medium-term call is more nuanced because the dashboard read on debt service tells you mortgage stress is building, and arrears data through the September quarter is the next test. We are constructive on the banks for the next two quarters and watching arrears for the inflection.
Miners stay the cleanest macro beneficiary, on the same logic we set out in the 24 April terms-of-trade piece. A stronger Australian dollar tied to the rate differential is the offset that makes the export commodity basket look better in AUD terms even when offshore demand is mixed.
Offshore-earner industrials with US consumer exposure deserve a closer look. CSL, ResMed, James Hardie, and Reliance Worldwide all have meaningful US end-market revenue. The healthcare names are reasonably defensive because their end demand is non-discretionary, but the building products names are sensitive to US housing, which is itself sensitive to the US consumer. James Hardie in particular has the most direct line into the question of whether US discretionary purchases hold up through the next two quarters.
Bond proxies are the other side of the same call. Listed REITs, infrastructure trusts, and long-duration growth names have been priced through the back half of 2025 on an easing-rate narrative that the May decision has now decisively reversed. Anyone holding an oversized position in this group is implicitly making a call that the RBA is done after Tuesday. The data does not support that call. Two-year yields fifty basis points higher in three months is the scenario worth running.
The Bigger Picture
The Australian consumer is in an unusual position by historical standards. Balance sheets are at or near record highs on the wealth side. Spending growth is at or near record lows on the cash-flow side. Both readings are real and both are coming from the same underlying setup, which is a household that owns appreciating assets while servicing record amounts of mortgage debt out of slow-growing income. That is sustainable when interest rates fall. It is fragile when they rise. The RBA decided on Tuesday that it had to keep rising.
The portfolio implication is to be paid for the consumer-cyclical risk you take and to be careful what you own outright. Domestic discretionary retail is the cleanest underweight. Banks, miners, and staples are the cleanest places to be in a domestic book. Offshore-earner industrials need a look-through to the US consumer, which the dashboard tells you is also softening. Bond proxies are the leg that has not yet repriced for the rate path the RBA is signalling.
We will know more after the next dashboard refresh and the August RBA decision. Between now and then, the consumer data is the read that matters.
Want to discuss how the post-RBA macro setup affects your portfolio? Call us on 1300 889 603 or book a call-back.