
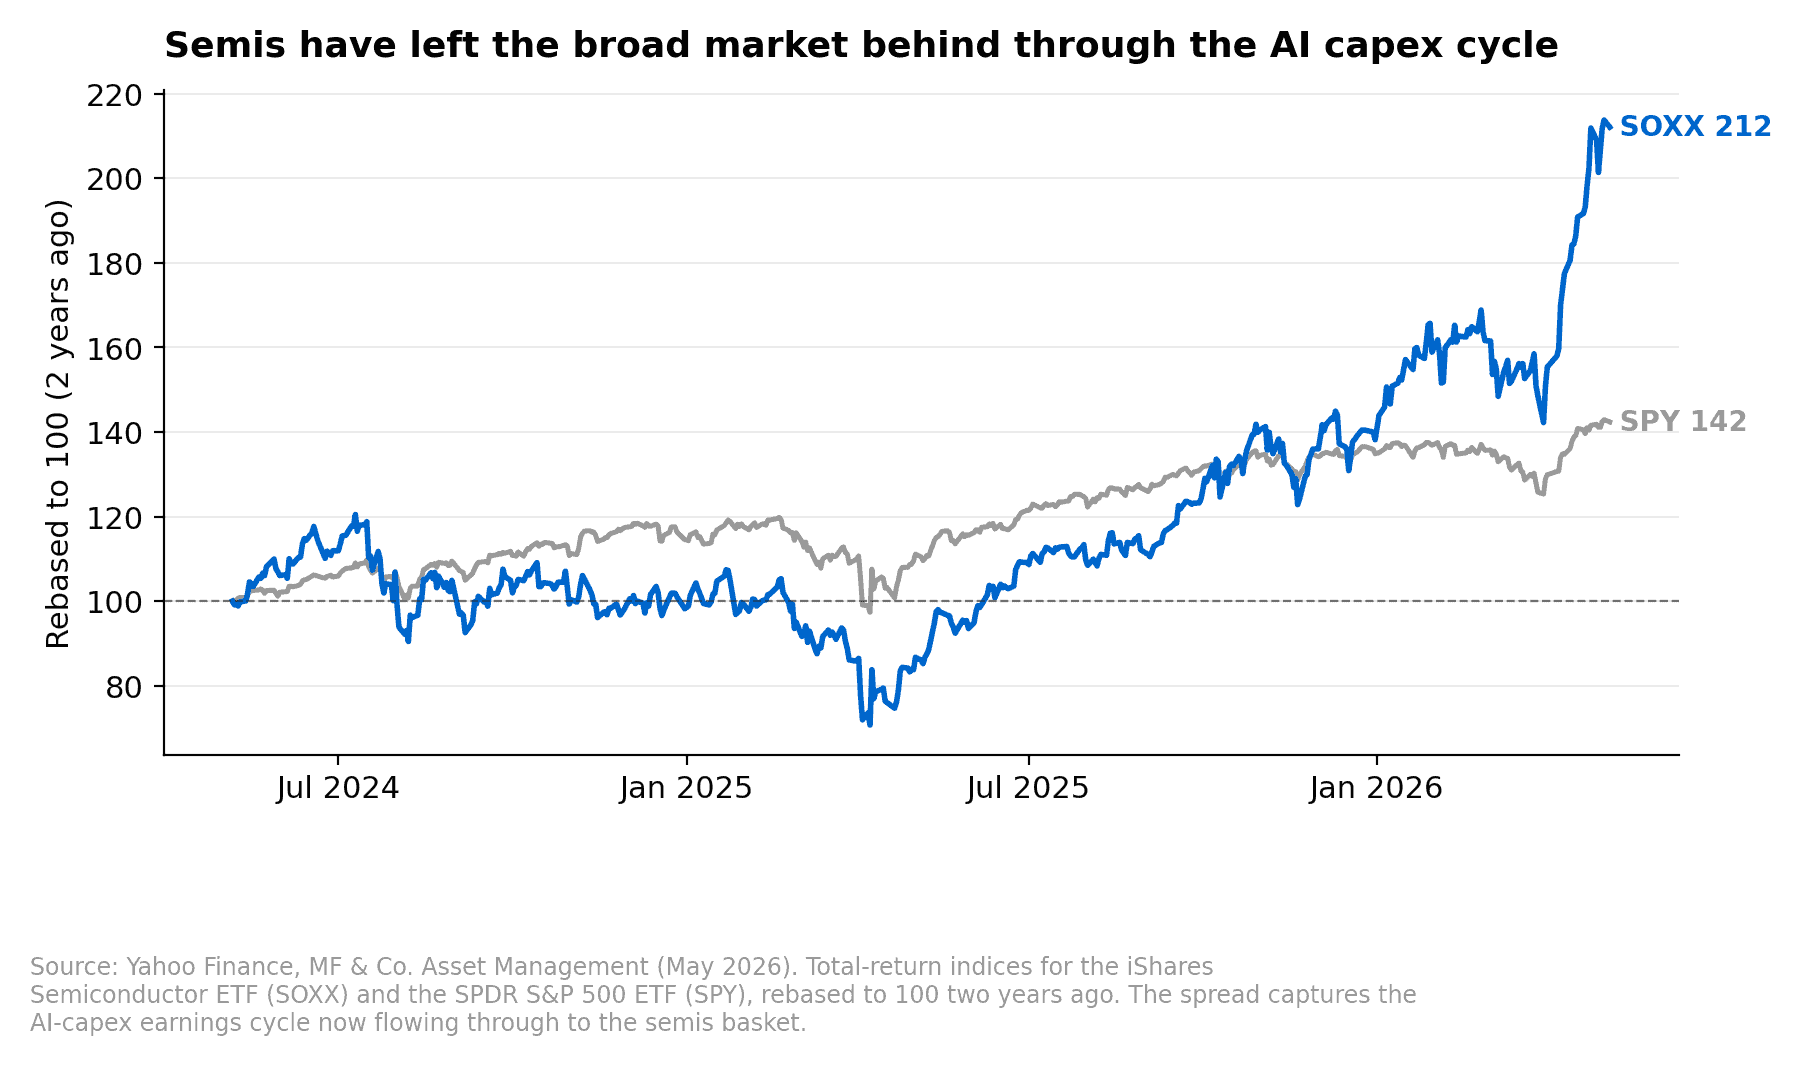
The semiconductor cycle is in a constructive setup, with the AI capital expenditure build-out continuing to pull through capacity commitments, design wins, and sub-segment by sub-segment recoveries. March monthly shipment data from the Semiconductor Industry Association showed integrated circuit units excluding memory up 29% month over month, well above typical seasonality and continuing a multi-month run of improving readings against the long-run trend. The picture is uneven across sub-segments, with compute, datacentre storage, and semiconductor capital equipment leading the recovery while microcontrollers and parts of the analog complex remain meaningfully below long-run trend. Institutional sell-side commentary on the group remains constructive, with most fundamental upside concentrated in compute, storage, and semiconductor capital equipment heading into 1Q earnings, and a clear preference for names that have been shipping furthest below trend and that show differentiated supply-chain execution. Near-term price action could be choppy as the market digests company-by-company prints, but the medium-term thesis around hyperscaler spending on AI infrastructure remains the dominant tide for the group.
Last updated: 27 April 2026. Sector outlook refreshed when new sell-side notes or material market moves warrant, not on a fixed cadence.
Table of Contents
- 1 About the Semiconductor Complex
- 2 Where the Cycle Sits Right Now
- 3 The AI Compute Cycle Is the Dominant Driver
- 4 The SemiCap Pull-In Is the Freshest Leg
- 5 Memory and Storage Are Diverging
- 6 Analog Is the Slow Recovery Story
- 7 The Tactical Setup Heading Into Earnings
- 8 Tools for Semis Exposure
- 9 Near-Term Risks
- 10 ETF Universe
About the Semiconductor Complex
The semiconductor industry covers everything from chip design and intellectual property licensing through to the equipment that fabricates wafers, the foundries that run production, and the packaged devices that go into phones, cars, datacentres, and industrial control systems. The US-listed semis universe sits in three pools.
The first pool is digital semis, the design houses that ship compute and connectivity silicon. Nvidia, AMD, Broadcom, and Qualcomm are the heavyweights, joined by EDA software platforms like Cadence and Synopsys that the design houses themselves use, and by Arm Holdings on the IP licensing side. The second pool is analog and mixed-signal, the slower-cycle workhorses for industrial, automotive, and consumer end markets, with Texas Instruments, Analog Devices, Microchip, NXP Semiconductors, and onsemi as the core names. The third is semiconductor capital equipment, the picks-and-shovels of the industry that supply the tools used to fabricate the wafers themselves, with Applied Materials, Lam Research, KLA, Teradyne, and Entegris dominating this part of the value chain.
The PHLX Semiconductor Index (SOX) captures the full complex. The most widely used single-ticker proxy is the iShares Semiconductor ETF (SOXX). Combined market capitalisation of SOXX constituents sits in the multi-trillion-dollar range, with a small number of names driving most of the cap weight.
Where the Cycle Sits Right Now
March data from the Semiconductor Industry Association shows total integrated circuit shipments running above normal seasonality. Headline IC units excluding memory printed up 29% month over month, against a historical median for that month around 22%, with units now sitting roughly 4% below the long-run three-month moving average trend. That is the best reading since November and a clear improvement from 7.8% below trend in February.
The “below trend” framing is worth a moment in plain English. SIA tracks how many chips actually ship into the channel each month, and compares that volume to where shipments would be running if growth had continued at its long-run rate without any cyclical interruption. When units sit below trend, it means a destocking cycle has temporarily shrunk the channel, and the gap between current shipments and the trend line is the runway for a recovery as inventory levels normalise.
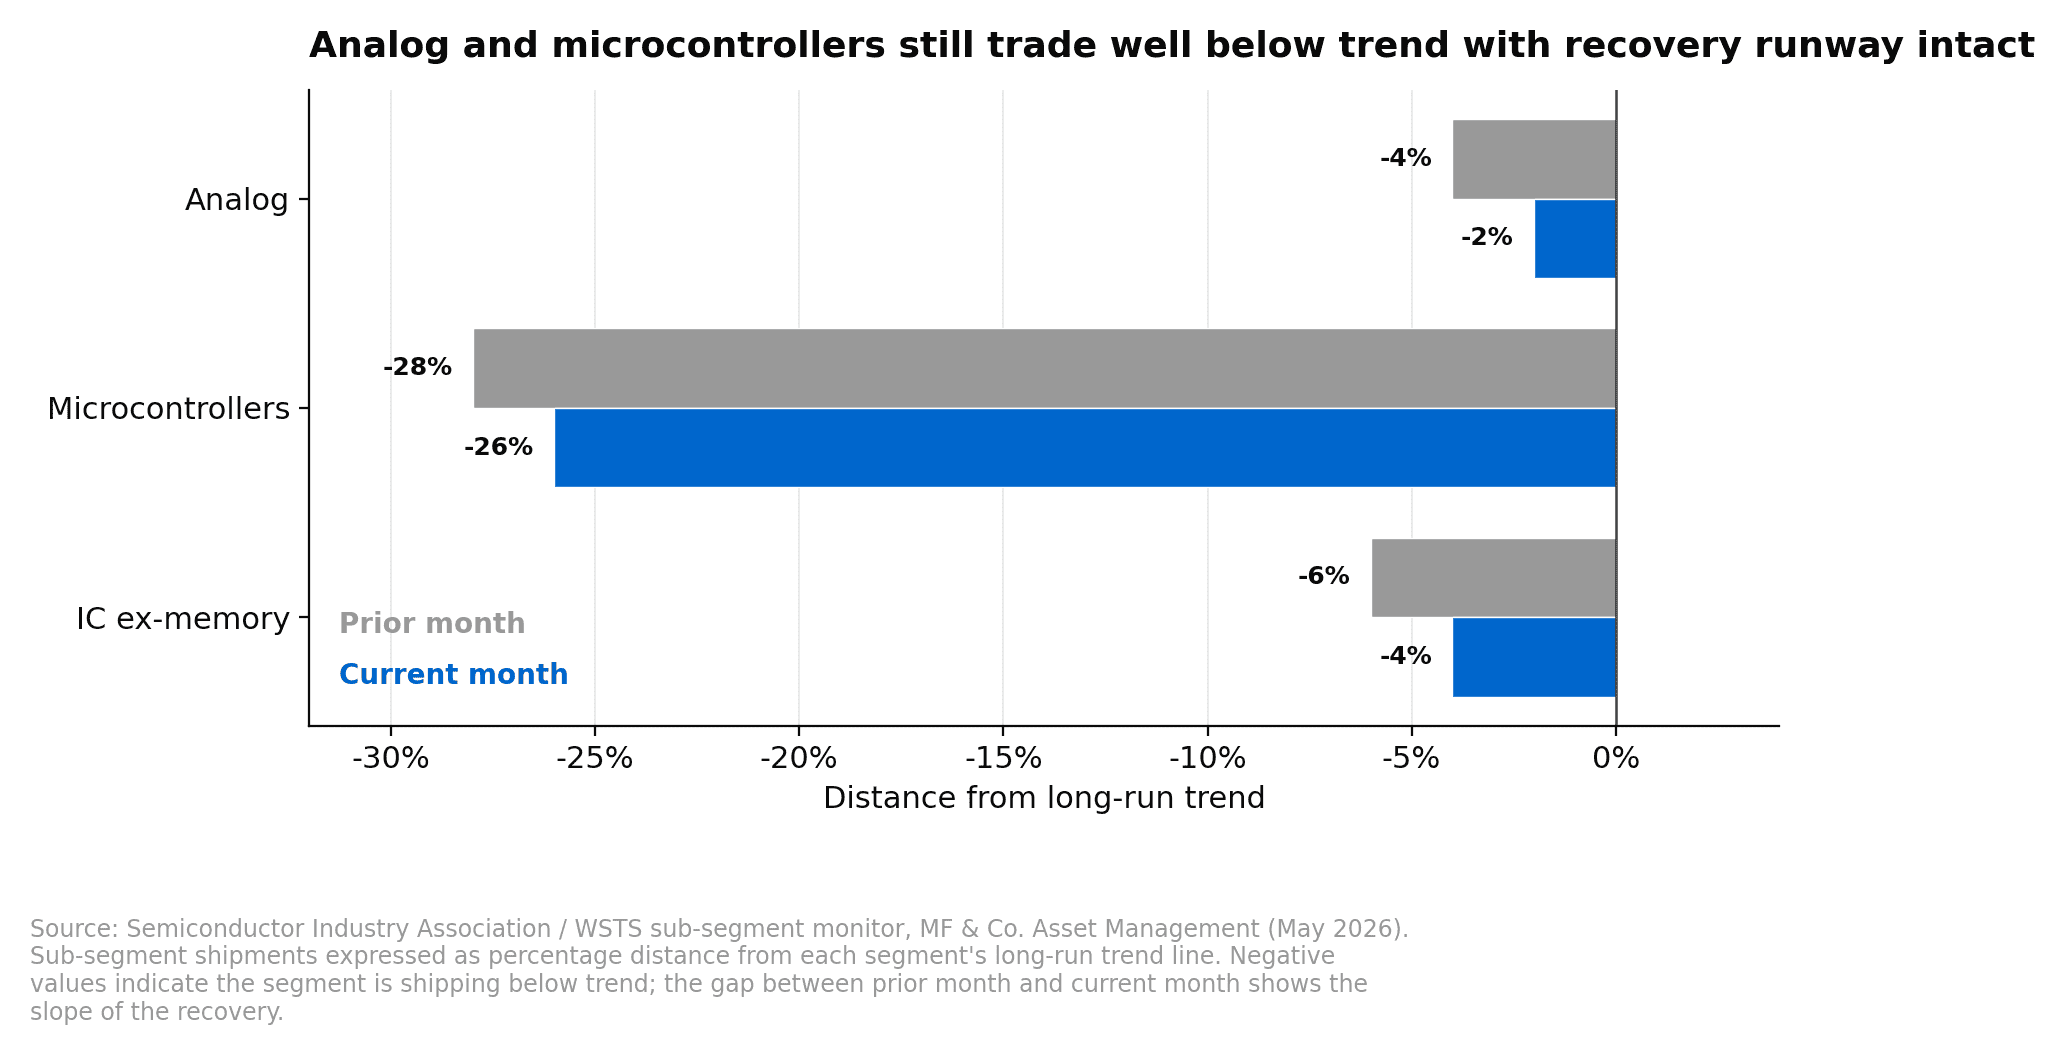
Sub-segment by sub-segment, the picture is uneven. Analog units came in 2% below trend versus 6.5% below in January. Microcontrollers were 26% below trend, better than 27.5% in January but still lagging meaningfully. DRAM units rose 5% month over month, below typical seasonality, while NAND rose 15%, ahead of seasonality. The pattern is consistent with company commentary suggesting customer inventory levels are normalising but still below long-run baselines, with the parts of the market shipping furthest below trend now showing the strongest sequential recoveries. The base case is that shipments continue to converge toward trend through the rest of the year as inventory restocking finishes and AI-driven demand keeps pulling ahead of consensus.
The AI Compute Cycle Is the Dominant Driver
The most important variable for the group is hyperscaler capital expenditure on AI infrastructure, which has continued to step up through 2025 and into 2026. Cloud providers and the major model-training operators are committing larger and earlier orders for both general-purpose server CPUs and AI accelerator silicon, and the order books have been moving up sequentially across consecutive quarterly updates. The downstream effect is that the digital design houses with direct exposure to that spend, including custom AI silicon, server CPUs, and networking, are seeing the cleanest fundamental setup heading into reporting season.
Compute upside is partly offset by ongoing weakness in the PC end market, but the mix shift toward server and datacentre is margin-accretive and is what is showing through in raised consensus revenue estimates.
Within the digital sub-segment, AMD looks favourably set up on server CPU strength tied to AI demand and agentic AI deployment at major hyperscaler customers. The PC piece will drag a touch, but the mix improvement more than carries the result, with the twelve-month price target sitting around US$240.
On the EDA side the cleanest pick is Cadence Design Systems. Custom ASIC design starts are accelerating across the industry, which feeds directly into Cadence revenue, and the recent Hexagon acquisition adds a digital simulation leg that is structurally less exposed to the AI-disruption fears that have weighed on broader software. The twelve-month price target sits around US$410.
Qualcomm sits in a more balanced position. Smartphone exposure is well understood and priced in, and progress on datacentre CPUs and ADAS gives the stock a way to surprise to the upside, with the twelve-month price target around US$135.
The cleanest cautious call in the digital sub-segment is Arm Holdings. The long-term server CPU royalty narrative is intact, but smartphone royalty weakness is likely to drag the near-term print and positioning is elevated after a strong run. The twelve-month price target sits around US$125.
The SemiCap Pull-In Is the Freshest Leg
The capital equipment makers, the picks-and-shovels of the chip industry, are seeing fresh upside as both DRAM memory makers and the leading-edge foundries pull capital expenditure commitments forward. SemiCap revenue tends to lead unit shipment data by roughly six to nine months, so when memory and foundry customers start releasing orders, the equipment makers’ books fill before underlying chip volume actually moves through the channel.
Across the SemiCap basket, the most constructive setup belongs to Applied Materials. Capacity pull-ins are showing in both DRAM and foundry, exposure is heavily weighted toward etch and deposition at around 60% of revenue, and there is room for the stock to keep re-rating toward peer valuation levels. AMAT remains the highest-conviction call in the group.
Lam Research is set up on a similar dynamic, with NAND recovery and updated wafer fabrication equipment forecasts the catalysts. The market share gain story remains intact, and the timing of the NAND recovery is the swing factor.
The relatively cautious call is KLA. Process control and metrology spending intensity is structurally lower in a DRAM-skewed cycle than in a foundry-skewed cycle, because inspection requirements are less demanding for memory, which leaves KLA likely to lag the rest of the SemiCap basket through this part of the cycle even though the long-term franchise quality is intact.
Teradyne is interesting on tester demand exposure across compute, optical, and memory, with potential disclosure around the company gaining share in GPU testing as one of the more meaningful catalysts.
Memory and Storage Are Diverging
Inside the memory and storage complex, our preference is for HDD and NAND over DRAM. The reason is supply-side, not demand-side. DRAM has incremental near-term capacity additions coming online from the major Korean and US producers, which moderates the pricing tailwind even as units recover, and that is the read-through from March’s softer DRAM monthly print. NAND, by contrast, has tighter capacity discipline holding through the cycle. HDD continues to benefit from durable enterprise demand for nearline storage that has held up better than the bear case feared.
SanDisk is set up for a strong NAND quarter on tight conditions and enterprise SSD wins. Seagate sits at the centre of the bull case for HDD pricing and margin trajectory, with long-term gross margin upside the key debate. Western Digital is on the more balanced side, with HDD pricing trajectory and gross margin upside the live questions. The asymmetric exposure for an investor wanting incremental memory and storage weighting is to lean toward NAND and HDD and underweight DRAM through the next few prints.
Analog Is the Slow Recovery Story
The analog complex is the most idiosyncratic part of the group, because end-market exposure varies heavily from name to name. Our preference is for analog companies with the greatest industrial, aerospace and defence, and datacentre exposure, and away from names dominated by smartphone and consumer end markets.
The cleanest setup in analog belongs to Microchip. A beat-and-raise quarter looks likely on the back of an ongoing recovery in industrial and aerospace and defence end markets, with gross margin trajectory now recovering as the cycle moves out of the inventory correction. The twelve-month price target sits around US$88.
NXP Semiconductors is set up well on a confirmed cyclical recovery in automotive, with a path back to mid-single-digit revenue growth that puts the company ahead of consensus. The twelve-month price target sits around US$276.
The slower bucket is onsemi, where end-market exposure is tilted toward silicon carbide for electric vehicles and image sensors, both of which face longer recovery timelines. The setup is more in-line than upside, with execution risk on the silicon carbide and image sensor businesses, and the twelve-month price target sits around US$60.
Texas Instruments has a more challenged margin trajectory than peers and is the cleanest cautious name in the analog space.
The Tactical Setup Heading Into Earnings
The cleanest constructive setups for the upcoming earnings season are concentrated in compute (AMD), capital equipment (AMAT, TER), datacentre and industrial-exposed analog (NXPI, MCHP), and storage (NAND and HDD names). The cleanest cautious setups are in process control equipment with low DRAM exposure (KLAC), idiosyncratic analog with negative end-market mix (ON), and IP licensing exposed to weak smartphone (ARM).
The names that have been furthest below trend, and that have shown the most differentiated supply-chain execution, are the ones we expect to lead the next leg of the recovery. That is consistent with how the cycle has played out historically when an inventory normalisation runs into a demand acceleration like the AI capex build.
Tools for Semis Exposure
For thematic exposure to the semiconductor industry on a buy-and-hold basis, the standard vehicle is SOXX, the iShares Semiconductor ETF, which tracks the PHLX Semiconductor Index. SOXX holds 30 US-listed semiconductor names spanning the full spectrum from chip design through capital equipment. A close alternative is SMH from VanEck, which is more concentrated in the very largest names. For an investor who wants conviction exposure to the AI compute cycle but does not want to pick winners at the individual stock level, a SOXX or SMH position gives diversified exposure with a single ticker.
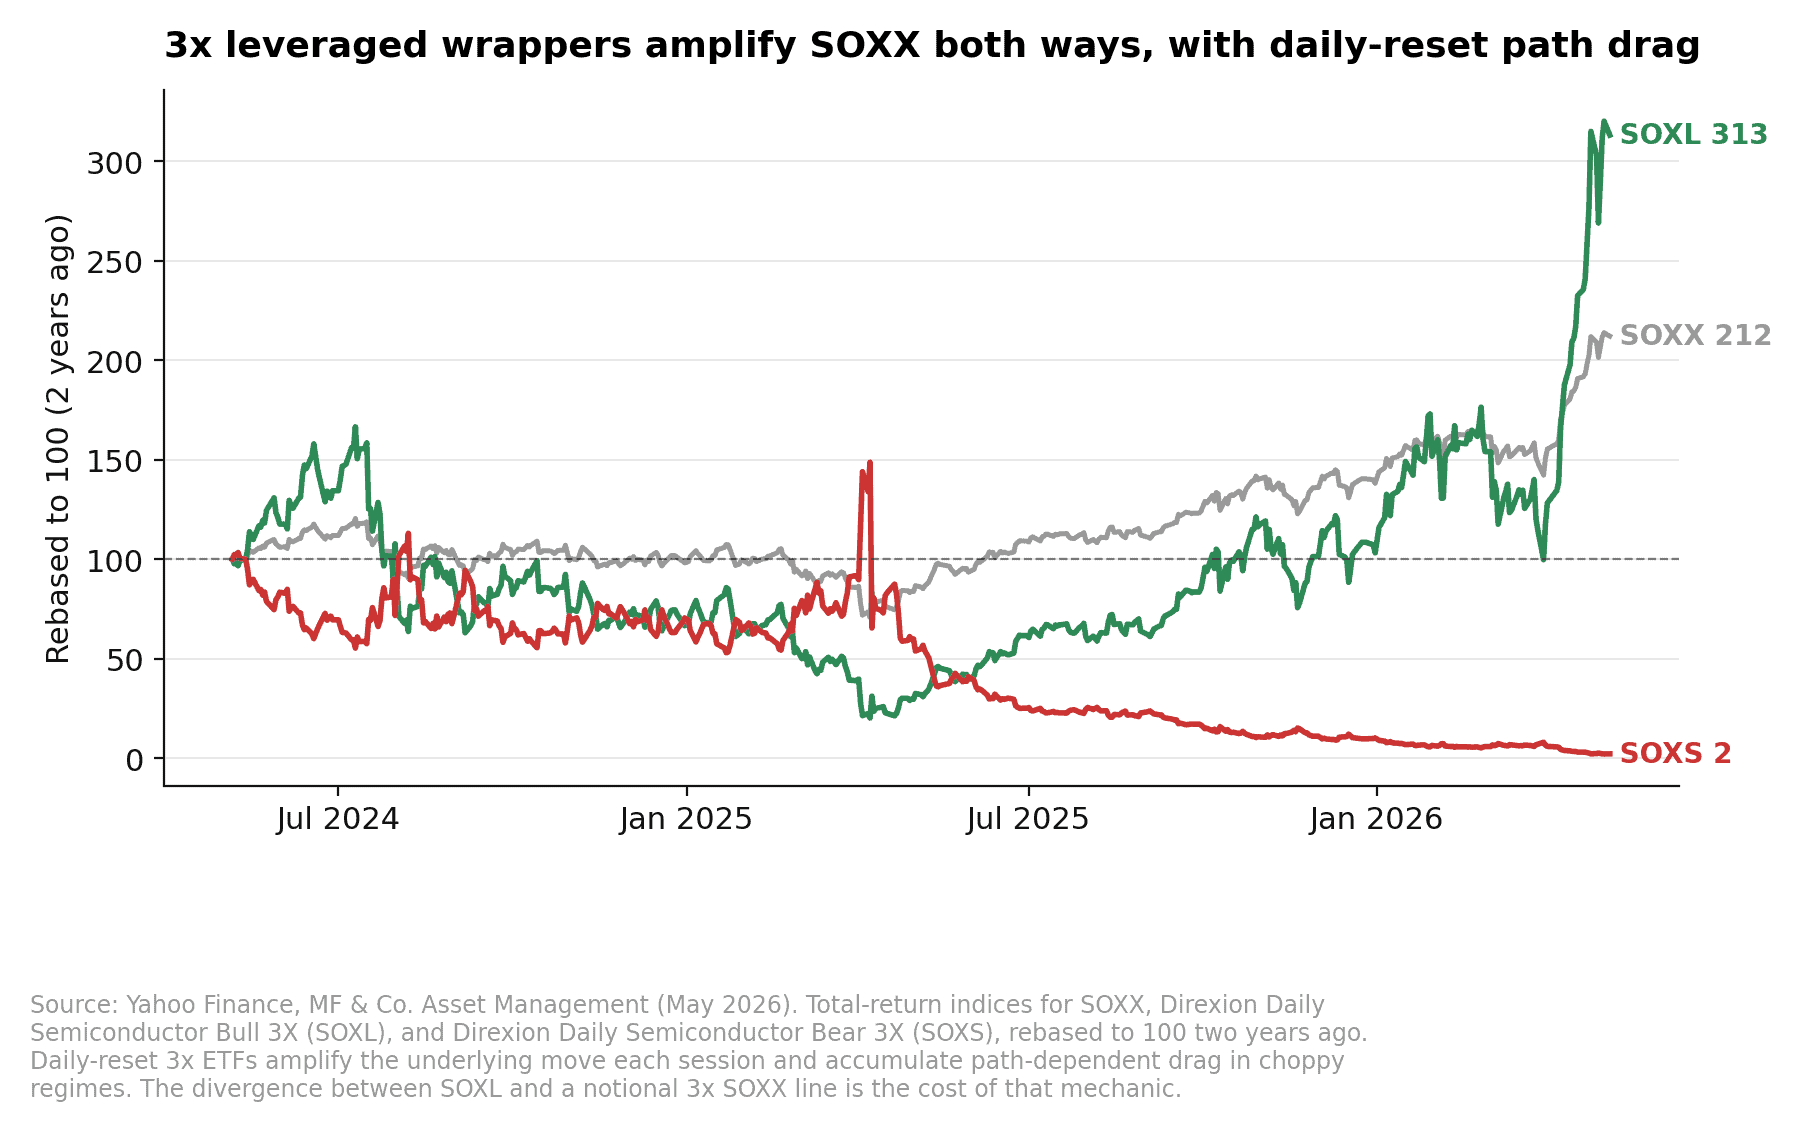
For tactical or systematic strategies, the leveraged 3x daily ETFs SOXL (long) and SOXS (short) become available. These are designed to be daily directional instruments and are not intended for buy-and-hold use because the way leveraged daily reset compounds in choppy markets is unfavourable to passive holders. Inside a defined trend-following or mean-reversion framework with explicit entry, sizing, and exit rules, the volatility decay risk that dominates passive holding becomes manageable, and the additional 2-3x daily leverage compounds returns when the signal works. Semiconductors are one of the highest-beta industries in the US market and exhibit some of the most persistent multi-month trends, which is why the leg sits inside the trend-following part of MFAM’s systematic framework rather than the mean-reversion side.
Free 5-day email course
Learn how we build and run systematic trading strategies
One short lesson per day on how rules-based strategies are framed, sized, and run live, drawn from the same playbook MFAM uses on its own systematic trading desk. No commitment, unsubscribe at any time.

Taught by Henry Fung
Founding Partner, MF & Co. Asset Management · AFSL 520442 · RG146, ADA1, ADA2 · Bachelor of Business & Accounting · 20+ years experience
Near-Term Risks
The first risk is that AI capex commitments slow more abruptly than expected, either on a hyperscaler budget reset or a temporary pause in deployment timelines. The cycle is unusually concentrated in a small number of buyers, and any signal that the order books are flattening at the top of the customer pyramid would be a meaningful clearing event for the highest-multiple compute names.
The second risk is geopolitical. Semiconductor export controls, tariff actions, and the broader US-China technology rivalry continue to introduce step-function risks to revenue, particularly for names with material direct or indirect exposure to Chinese end customers.
The third risk is the PC end market, which has been weak and could remain so for longer than consensus expects, dragging the lower-end of the consumer-exposed cohort.
The fourth risk is that the analog and microcontroller recovery takes longer than expected, particularly if industrial production indices roll over before order book repair finishes.
None of these risks change the medium-term picture, but each one can deliver a sharp short-term derating in a sector that runs at the top of the equity beta distribution.
If you would like to discuss the semiconductor industry or how this exposure might fit within your portfolio, request a callback or call us on 1300 889 603.
ETF Universe
The ETFs MFAM references for the semiconductor industry, both the vanilla 1x vehicles for thematic buy-and-hold exposure and the leveraged 3x vehicles used inside the systematic engine, are listed below for reference.
- SOXX · iShares Semiconductor ETF · 1x PHLX Semiconductor Index, long, vanilla
- SMH · VanEck Semiconductor ETF · 1x MVIS US Listed Semiconductor 25, more concentrated than SOXX
- SOXL · Direxion Daily Semiconductor Bull 3X · 3x daily long PHLX Semiconductor
- SOXS · Direxion Daily Semiconductor Bear 3X · 3x daily short PHLX Semiconductor
Note. Leveraged ETFs are designed for daily directional exposure and exhibit volatility decay over multi-day holding periods. They are appropriate inside a systematic trading framework with defined entry, sizing, and exit rules, not as buy-and-hold instruments.