

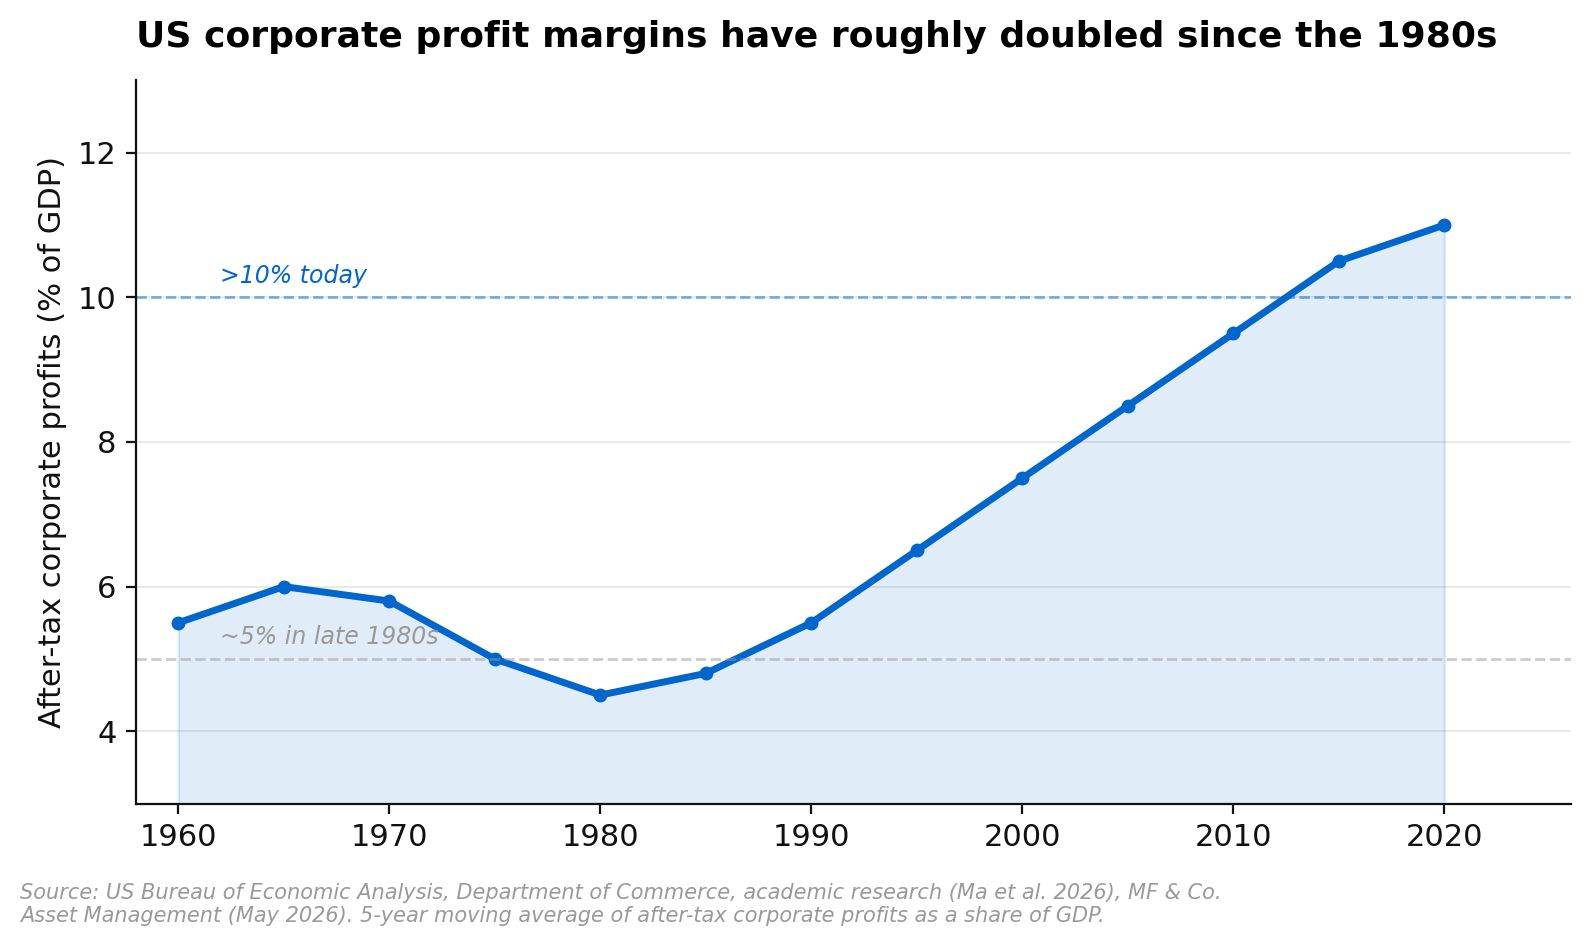
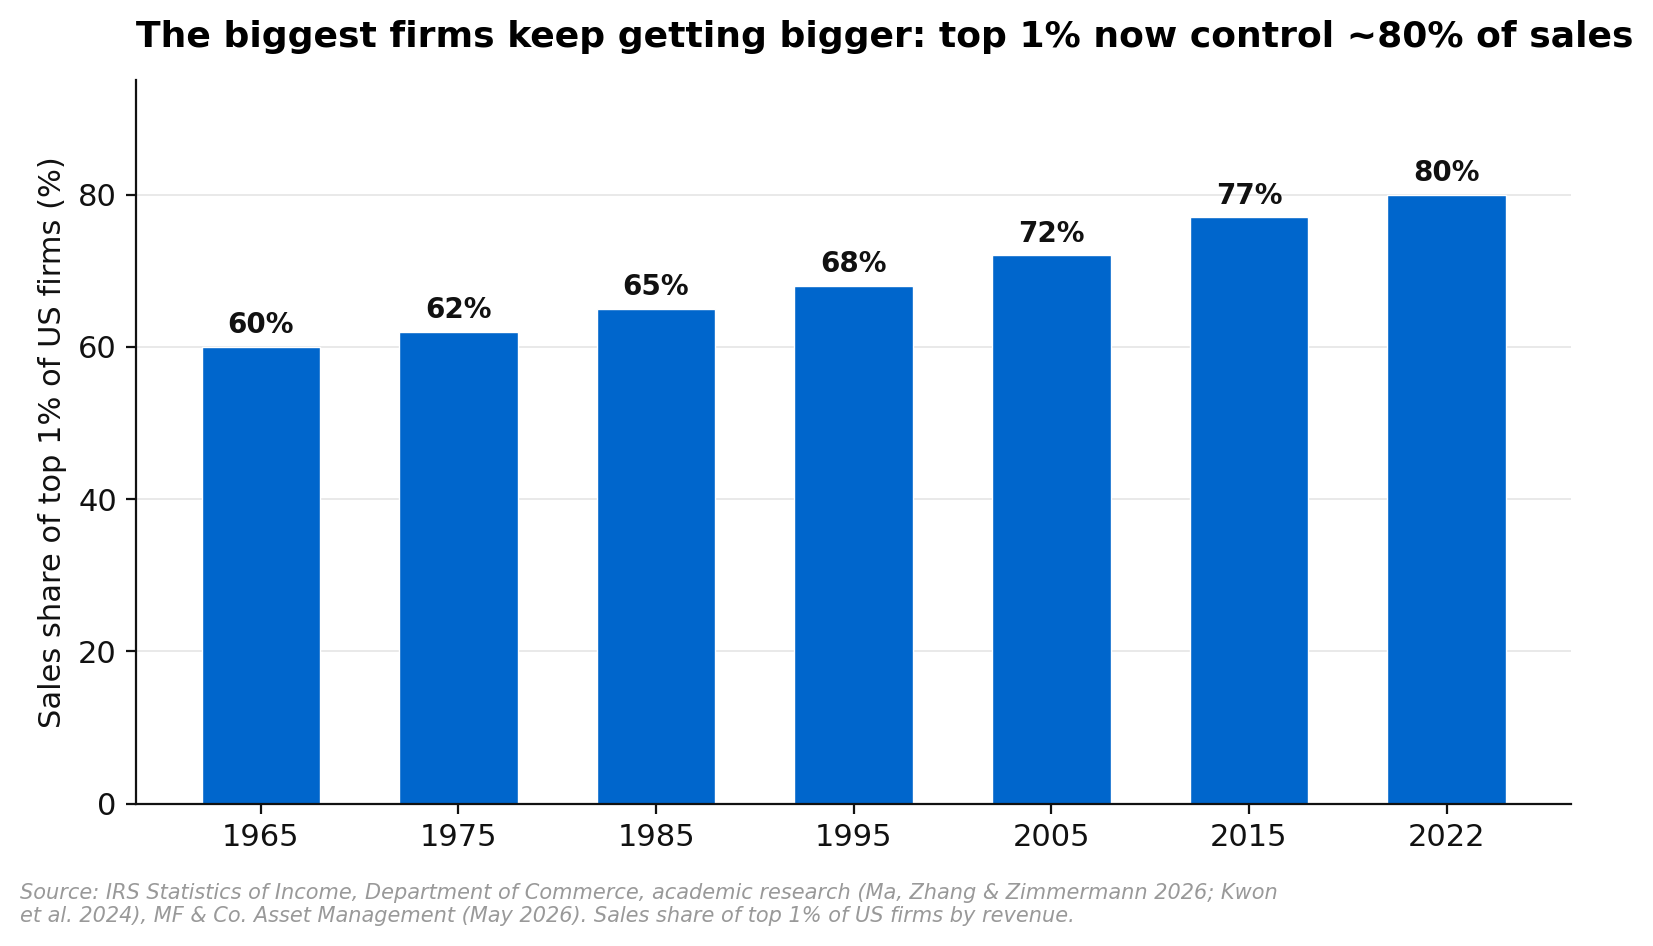
Corporate profits in the United States have roughly doubled as a share of GDP since the 1980s. At the same time, the biggest firms have captured an ever-larger slice of total sales, with the top 1 per cent now accounting for roughly 80 per cent of US corporate revenue, up from around 60 per cent in the 1960s. New economics research spanning nearly a century of tax and administrative data finds that rising concentration has accounted for roughly one-third of the increase in profit margins over the past two decades. The question for investors now is whether AI will intensify this trend or reverse it.
Research published 22 May 2026. Analysis draws on institutional economics research and academic data (Ma et al. 2026, Kwon et al. 2024, De Loecker et al. 2020).
Profit Margins Have Roughly Doubled
After-tax corporate profits as a share of US GDP have risen from approximately 5 per cent in the late 1980s to over 10 per cent today. This is not a cyclical blip. The increase has been persistent across decades and has continued through multiple recessions, recoveries and monetary policy cycles. US firms have substantially raised their markups over the same period, with the ratio of prices to marginal costs increasing from roughly 1.2 times in the early 1980s to approximately 1.6 times today.
Two forces explain the rising markups. First, consumers have become less price sensitive. Research estimates that across more than 100 product categories, US consumers became roughly 30 per cent less responsive to price changes between 2006 and 2019. Higher incomes raise the opportunity cost of time spent comparison shopping, which means firms can retain wider margins rather than pass cost savings through to consumers. Second, rising concentration at the national level has reduced competition, giving dominant firms greater pricing power.
The Biggest Firms Keep Getting Bigger
New data spanning nearly a century of US tax and administrative records documents a long-run rise in corporate concentration that is broader and deeper than most investors appreciate. The sales share of the top 1 per cent of US firms has risen from roughly 60 per cent in the 1960s to around 80 per cent in recent years. This is not just an American phenomenon. Across Austria, Denmark, France, Germany and Switzerland, the comparable figure has risen from a similar starting point to roughly 70 per cent over the same period. Australia, Canada, Singapore, South Korea and the UK show a similar upward trend.
Three explanations have been proposed for why concentration keeps rising. The first, globalisation, finds little empirical support: increases in trade openness have not been associated with larger increases in concentration across advanced economies. The second, weaker antitrust enforcement, has plausibly played some role, but concentration has risen at a broadly similar pace across different US antitrust regimes since the 1960s. The third, and the most compelling, is technology itself. New technologies tend to involve high fixed deployment costs and low marginal costs of scaling, which means firms with the capital and organisational capacity to invest can spread those costs across a larger output base, capturing market share from smaller rivals. The rise of platform businesses with strong network effects, where the value of a service grows with its user base, has turbocharged this dynamic.
Concentration Is Directly Linked to Higher Margins
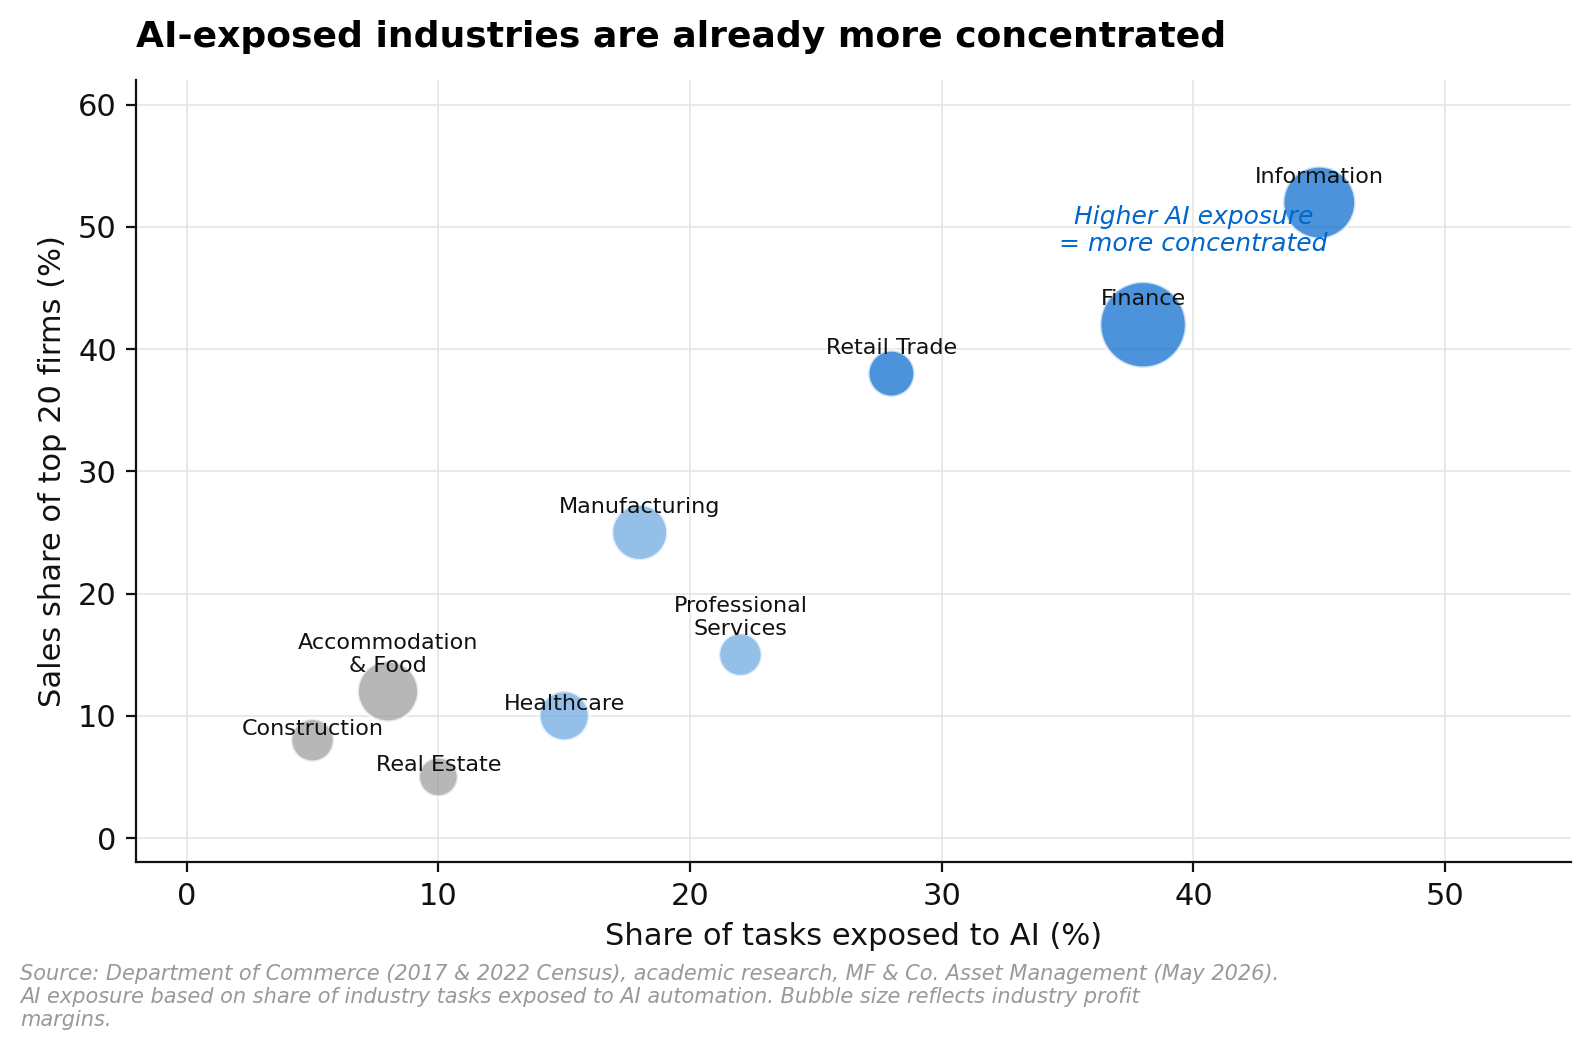
The link between concentration and profitability is not just a correlation. Economics research combining concentration data with industry-level profit margins from the Bureau of Economic Analysis estimates that rising concentration accounts for roughly one-third of the increase in corporate profit margins since 2000. The industries with the largest increases in concentration, led by information, retail trade and finance, have also seen the largest increases in margins. The rise in profitability at dominant firms in turn helps explain elevated levels of equity market concentration, because more profitable companies are worth more.
One important nuance: national-level concentration figures can overstate the decline in competition that consumers actually experience. In many local markets, particularly in retail trade, financial services and accommodation, larger firms have increasingly entered areas that were previously dominated by a handful of small local operators. A town gaining a national retailer alongside its existing local shop may have more competition than before, even as the national concentration figures rise. But this local-level benefit can be temporary: the entry of large firms initially reduces local concentration, but over time it can also drive out smaller rivals, leaving the surviving firms with wider margins and greater market power.
AI Could Go Either Way. History Says It Will Favour the Incumbents.
The industries most exposed to AI, measured by the share of tasks within each industry that are susceptible to AI automation, are currently somewhat more concentrated and operate with higher profit margins than the broader economy. Information and finance sit at the top of both the AI exposure and concentration rankings. AI disruption could plausibly foster greater competition in some of these industries by lowering barriers to entry and enabling smaller firms to automate tasks that previously required large teams.
But the historical lesson from previous technology shocks is clear. Every major wave of new technology over the past six decades, from mainframes to the internet to cloud computing, has ultimately raised concentration rather than reduced it. The successful investment in intangible capital needed to deploy new technologies effectively tends to accrue to leading firms, as scale and network effects compound their advantage. Frontier firms, those in the top decile of productivity growth, have far outpaced the economy-wide average in recent decades, and the gap is widening. Productivity dispersion has increased most dramatically in the industries most transformed by new technologies, including semiconductor manufacturing, electronics, and online retail.
For investors, this points to a continuation of the existing trend: the companies that are already investing most heavily in AI infrastructure, those with the capital, data, and distribution to deploy it at scale, are the most likely beneficiaries. The competitive moat that technology creates does not get narrower with each new wave. It gets wider.
What This Means for Portfolios
The research carries three practical implications for investors.
First, the elevated level of corporate profit margins is not a mean-reverting anomaly. It is a structural feature of an economy where the largest firms operate with durable scale advantages, strong pricing power, and declining consumer price sensitivity. Waiting for margins to normalise back to historical averages is unlikely to be rewarded.
Second, concentration risk in equity portfolios is not going away. The same forces that have driven concentration higher for six decades are being amplified, not dampened, by AI. Index investors should understand that they are increasingly making a concentrated bet on a small number of dominant firms, which has worked exceptionally well but carries meaningful single-stock and sector risk.
Third, the biggest beneficiaries of AI are likely to be the firms that are already dominant, not upstart challengers. This does not mean no new entrant will ever succeed. But the base rate from previous technology cycles is that the firms with the capital, data and distribution infrastructure to deploy new technology at scale are the ones that capture the majority of the economic value. Investing in the incumbents with the largest AI capex programs remains the path of least resistance.
Interested in how we can help? Get in touch with our team or call us on 1300 889 603.