
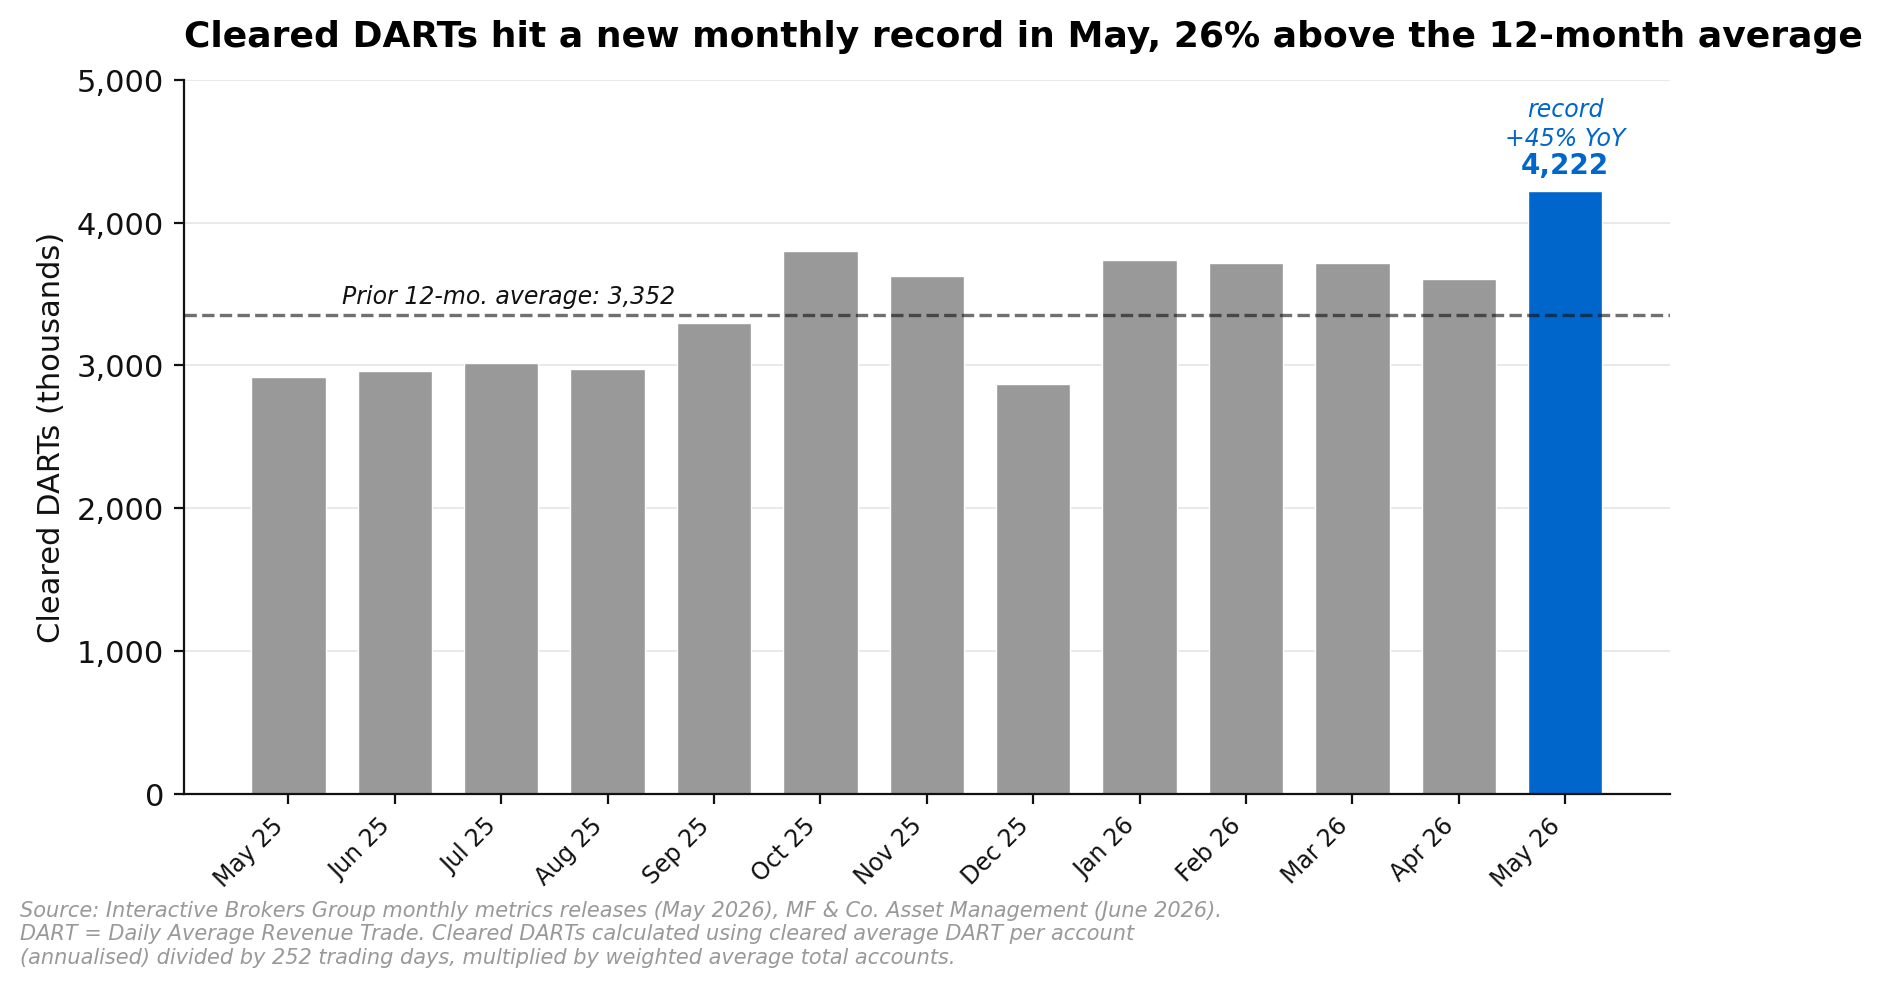
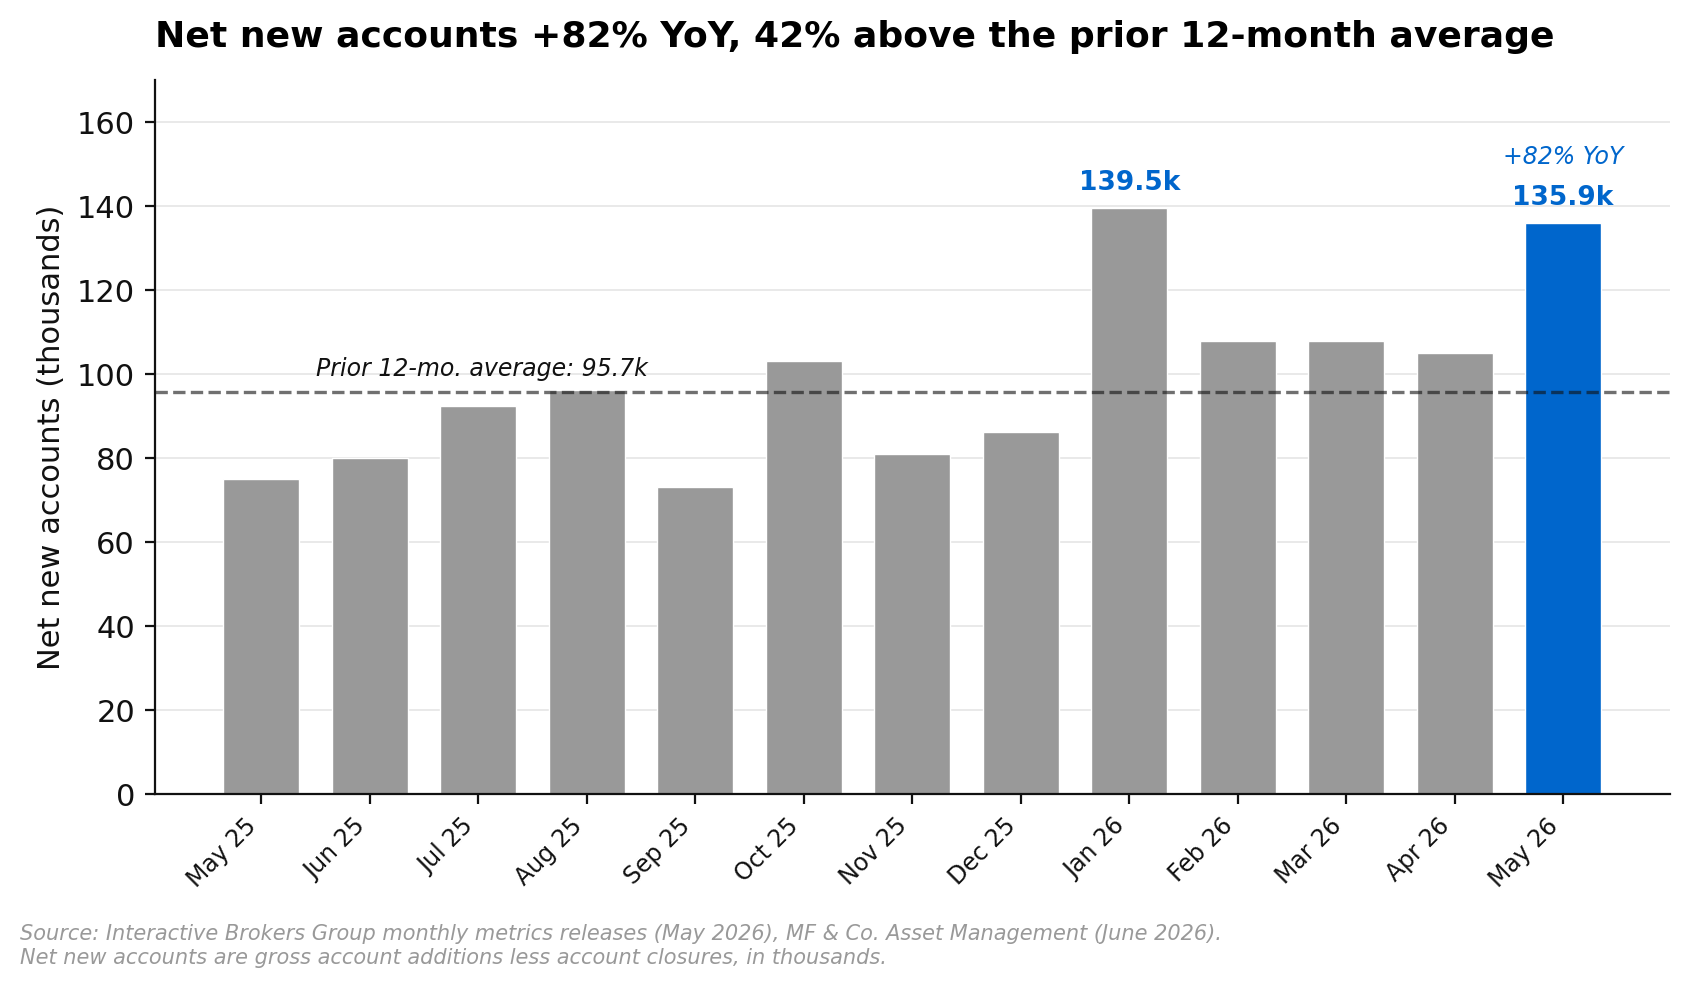
Interactive Brokers closed at US$86.97 on 29 May ahead of its monthly metrics release for May 2026, and the print that followed has reset the upside in our view. Institutional sell-side research has IBKR rated Buy with a 12-month price target lifted to US$109, implying approximately 25% upside. The May numbers were a clean sweep: record monthly cleared Daily Average Revenue Trades (DARTs) of 4.22 million (+45% year on year), 135.9 thousand net new accounts (+82% year on year), client equity at US$937 billion (+49% year on year), and margin balances at US$101 billion (+65% year on year). DARTs are the broker’s headline activity metric, counting the number of commission-generating client trades cleared each day, which is why they tie almost directly to commission revenue. Annualised account growth of 33.6% now sits comfortably above the high end of management’s prior long-term guidance of 20% to 25%, and the operating leverage in the platform is starting to show through across every line.
Research published 3 June 2026. Price target and upside based on prices at time of publication.
Table of Contents
- 1 About Interactive Brokers
- 2 Record DARTs Reset the Earnings Power of the Platform
- 3 Account Growth Is Running Well Above the Long-Term Guide
- 4 The Balance Sheet Is Compounding Faster Than the Income Statement
- 5 Estimates Move Higher and the Price Target Lifts to US$109
- 6 Valuation
- 7 Risks to the Buy Call
- 8 Our View
- 9 Financial Summary
About Interactive Brokers
Interactive Brokers Group is a global electronic broker that builds and operates a direct-market-access trading platform for active retail investors and small to mid-size institutions. The group serves clients across more than 200 countries and territories, with access to 160 markets globally, and is best known for the lowest commission and margin rates in the industry alongside professional-grade execution and risk technology. The company generated US$6.16 billion in revenue in FY25 and now has approximately five million customer accounts, with client equity of US$937 billion. IBKR has a market capitalisation of approximately US$147.5 billion and is listed on the NASDAQ. Quarterly filings, investor presentations, and the monthly metrics releases are available on the company’s investor relations page.
Record DARTs Reset the Earnings Power of the Platform
May cleared DARTs of 4.22 million were a fresh monthly record, up 45% year on year and 17% month on month, with the new high coming in 26% above the prior 12-month average. The mix of growth matters as much as the headline. Stock DARTs rose 23% month on month, options DARTs rose 10%, and futures DARTs were down 3%. The blended skew towards stocks and options is healthy because those product lines carry the higher commission per trade and re-balance the revenue base away from the more volatile futures engine. Total commissions per day came in at US$11.0 million, up 44% year on year, with average commission per trade easing 1.5% year on year to US$2.60 as larger active accounts and futures volume mix produce a small drag on take rate. The take rate compression is well telegraphed and is, in our view, a function of scale rather than price competition.
The 12-month run rate is what reframes the earnings model. Annualised trades per account of 216 are up 14% year on year and 10% month on month, and that engagement is being applied to a steadily larger account base. Trades per account is the variable that historically swings most with market volatility, and the May print suggests that elevated index moves through the spring have re-engaged the active end of the customer file. We see this as a structural tailwind rather than a one-off because the account base IBKR is monetising today is materially larger and more international than it was at the equivalent point in any prior trading cycle.
Account Growth Is Running Well Above the Long-Term Guide
IBKR added 135.9 thousand net new accounts in May, up 82% year on year and 42% above the prior 12-month average of 95.7 thousand. Total accounts at the end of the month were up 32% year on year, well above the high end of the company’s prior long-term account growth guide of 20% to 25%. Annualised account growth of 33.6% was 7.1 percentage points higher than at the end of April, which is the kind of inflection that usually shows up after a sustained period of brand and product investment rather than from a single quarter of marketing spend.
Two structural drivers are worth flagging. First, geographic diversification keeps widening. The United States is now only 18% of monthly app downloads and 23% of monthly active users, with Hong Kong, Canada, Singapore, Germany, the United Kingdom, Spain, Australia, and Mainland China each contributing meaningful share. The pie is genuinely global in a way that most US broker-dealer franchises are not. Second, monthly active users rose to a 1.6 million year-to-date average, up from 1.4 million in 2025 and 88% above the 2024 baseline. That MAU expansion has historically led DART growth by a few quarters, which gives us reasonable confidence the recent run rate is not a fluke driven by short-term volatility.
The Balance Sheet Is Compounding Faster Than the Income Statement
Margin lending balances rose approximately US$10 billion month on month to US$101 billion, up 11% month on month and 65% year on year. Total cash balances added US$4.5 billion to US$180.1 billion, up 34% year on year, and client equity rose US$66 billion to US$937 billion, up 49% year on year. The balance sheet is doing two things at once. Larger margin balances drive higher net interest income, and larger client cash and equity provide a base that grows with markets even before any client activity is added on top. Institutional sell-side analysts have lifted FY26, FY27, and FY28 net interest income estimates by 2% to account for the faster than expected balance sheet expansion, and the through-cycle leverage in the business is widening as a result.
The NII tailwind also helps to absorb the modest commission-per-trade compression flagged earlier. Even with average commission per trade easing 10 cents month on month following the annual SEC fee change in May, commissions per day still rose 9.6% month on month and 30.7% year on year. The point is that the revenue model is now diversified enough that small wobbles in any single line do not derail the trajectory. That diversification is part of what underpins the institutional sell-side Buy view on the name.
Estimates Move Higher and the Price Target Lifts to US$109
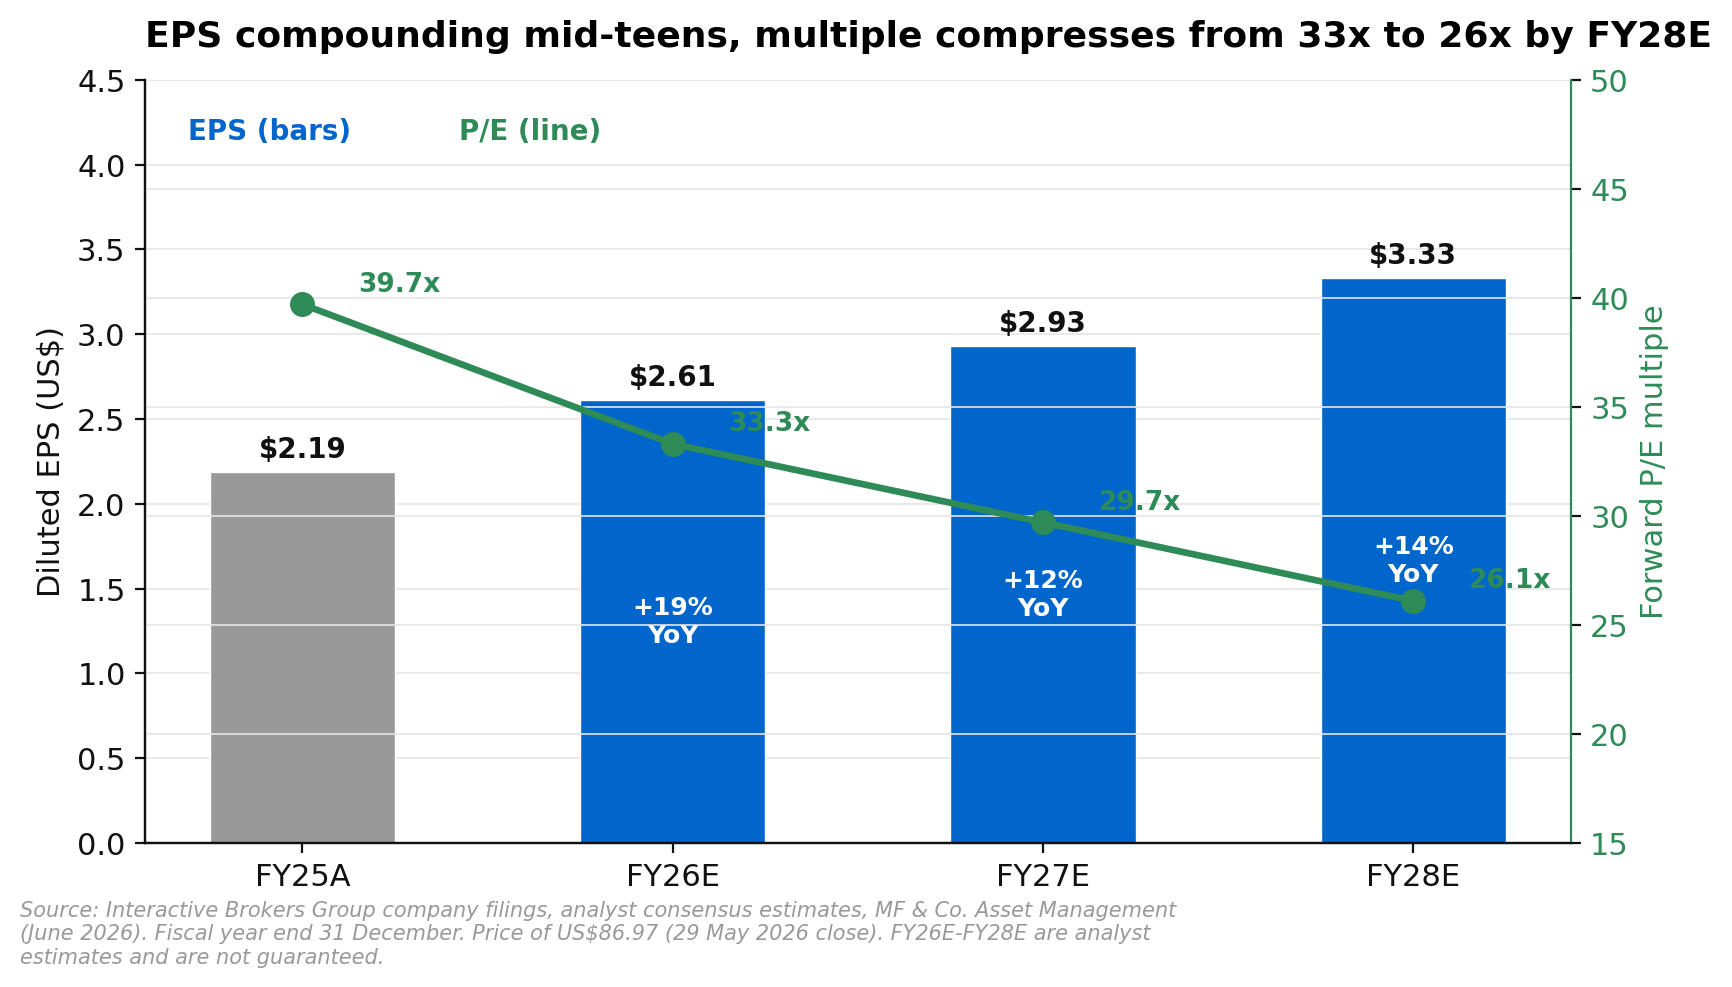
Following the May print, institutional sell-side EPS estimates for FY26, FY27, and FY28 have been lifted by 4%, 4%, and 3% to US$2.61, US$2.93, and US$3.33 respectively. Commission revenue forecasts were raised by 7%, 5%, and 3% to reflect the stronger DART and account growth profile, with NII tracking 2% higher across the same period. The Q5 to Q8 forward P/E was rolled up by one turn to 36 times to account for higher market multiples, and the 12-month price target lifted by about 7% to US$109 from US$102. At the new target, IBKR trades on roughly 33 times FY26 earnings, compressing to 29.7 times FY27 and 26.1 times FY28 as EPS scales.
Valuation
At US$86.97, IBKR trades on approximately 33 times FY26 estimated EPS of US$2.61, compressing to about 30 times FY27 estimates of US$2.93 and 26 times FY28 estimates of US$3.33. The US$109 institutional sell-side price target is anchored on the Q5 to Q8 EPS estimate of US$3.02 applied to a 36 times forward P/E, with the multiple reflecting the structural account growth running ahead of management’s long-term guide, the global diversification of the user base, and the NII leverage on a balance sheet that is expanding at a high-40s percent year-on-year rate. The implied return profile combines 25.3% price appreciation with a small dividend yield of around 0.5%, taking total expected return into the mid-twenties.
Risks to the Buy Call
The main downside risks centre on the pace of account growth and the variability of revenue per trade. A deceleration in net new account additions, or fewer trades per account in a less volatile market regime, would compress both the commission and NII contributions. A sustained drop in commission per trade beyond the modest mix-driven step down we have already seen would also pressure margins, particularly if futures volumes recover faster than stocks and options. A faster than expected pace of interest rate cuts would reduce the NII leverage that the larger balance sheet is currently capturing, and a meaningful drawdown in equity markets would weigh on margin balances, client equity, and engagement. The balance sheet is conservatively positioned, but the operating model is geared to client activity, which in turn is correlated with market behaviour.
Our View
Institutional sell-side has the stock at a Buy with US$109 of fair value. At 33 times forward earnings today, compressing to 26 times by FY28 on EPS that is being revised steadily higher, an account base growing 32% year on year, and a balance sheet expanding at a high-40s percent year on year, the risk-reward looks attractive after a year where the share price has lagged the underlying earnings revisions. The 12-month price target has moved from US$78 last August to US$109 today, and EPS for FY26 has been revised up by 4% in the past month alone. That combination, where the analyst is chasing the operating performance higher rather than the share price doing the work, is usually a good setup for the next leg.
The swing factor is account growth durability. If the high 30s annualised growth rate holds, the operating leverage compounds and the multiple comfortably absorbs the implied earnings power. If account additions revert to the prior 20% to 25% guide and trading activity normalises with a less volatile market regime, the trajectory still looks reasonable but the upside narrows.
If you would like to discuss Interactive Brokers or how US financial services equities might fit within your portfolio, request a callback or call us on 1300 889 603. The above is general advice and does not consider your individual circumstances. Past performance is not a reliable indicator of future returns.