

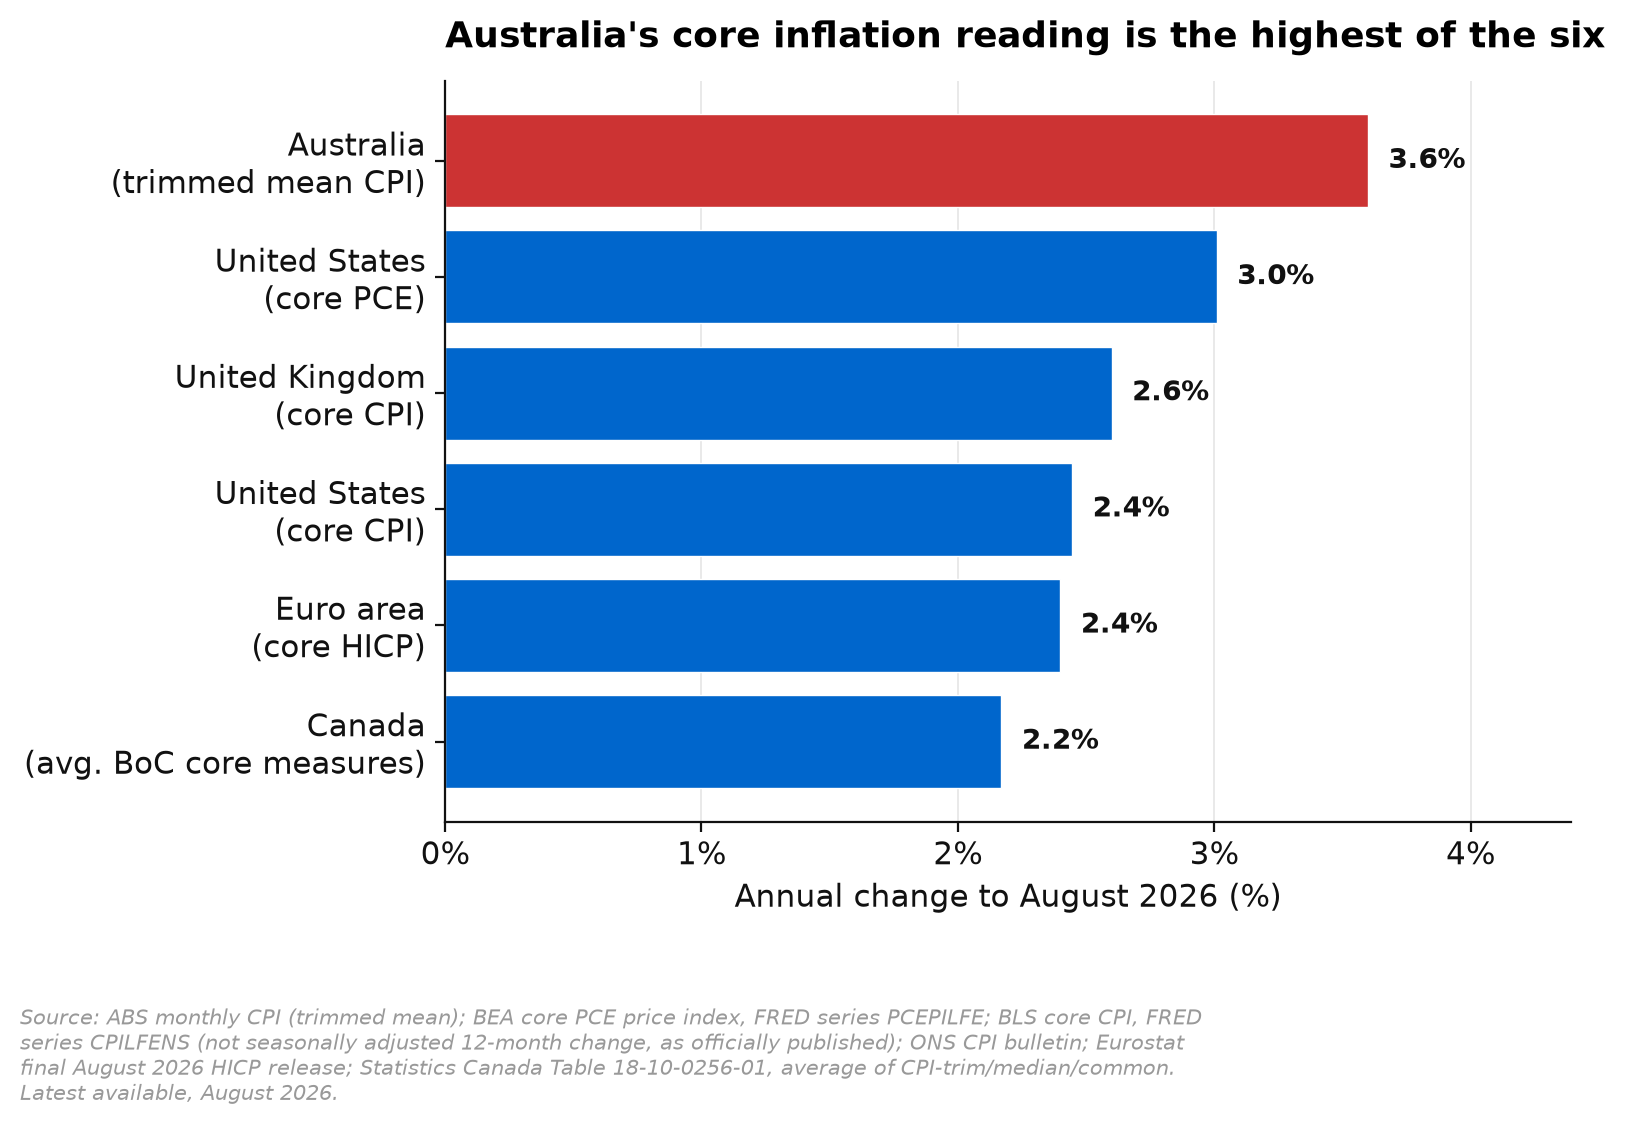
A note published by institutional sell-side research in late September asks a simple question. Which parts of the world still have a genuine inflation problem? Among countries where inflation is still running above target, the research finds the main driver is services and labour costs, not goods, with three named exceptions: Brazil, the US on its core PCE measure, and Australia, where core goods inflation accounts for a larger share of the overshoot. We went back to the official public data to check what that Australian exception actually looks like, and the public data is consistent with it. Our own core inflation reading is currently the hottest of six readings across five major economies compared here, and it is a goods problem, not a services one, the same shape of problem as the one playing out in Washington, even though the mechanism behind it is different.
Research published 2 October 2026. All figures from the ABS, BLS, BEA, ONS, Eurostat, Statistics Canada and institutional sell-side economics research.
Six Readings, Five Economies
Start with the plain comparison, each figure taken directly from the relevant central bank or statistical agency’s own August 2026 release rather than from any third party’s chart. The Euro area’s core measure, which strips out energy, food, alcohol and tobacco, sits at 2.4%. The UK’s core CPI is at 2.6%. Canada’s trio of Bank of Canada core measures average 2.2%. The two US core gauges sit at 2.4% on the CPI measure and 3.0% on the PCE measure; PCE is the Fed’s preferred underlying inflation gauge, though its formal 2% objective is set on headline PCE, not core. Australia’s trimmed mean, the Reserve Bank’s preferred core gauge, comes in at 3.6%, the highest of the six readings compared here.
That last point, naming Australia alongside the US and Brazil, is as far as the research goes; it does not work through what the exception means for an Australian audience. The framing that the US is the inflation outlier is true as far as it goes, especially against the Fed’s 2% objective, but it understates the picture once Australia’s own public data is checked against the same goods-versus-services lens.
Why Core, Not Headline, Is The Number That Matters
Australia’s headline CPI for the year to August is 4.0%, 0.4 percentage points above the 3.6% trimmed mean. Economists and central banks look through the headline figure to a core measure precisely because the headline number can be dominated by a handful of volatile movers in any given month, a fuel price spike, an electricity bill swinging on the presence or absence of a government rebate, a one-off tax change. The trimmed mean does this mechanically, calculating the average price change after cutting away the components with the largest rises and the largest falls each period, so that a small number of outsized moves cannot drag the whole read. A double-digit jump in electricity or automotive fuel is the kind of outsized, volatile movement that methodology is designed to drop from the calculation each period, though the ABS does not publish which specific components are trimmed in any given month.
That Australia’s trimmed mean is still the hottest of the six readings in this comparison is what makes the result worth taking seriously rather than dismissing as a headline artefact. It is a core measure built to look through the largest single-category moves in any given month, and it is still above every other reading in the sample.
What Is Actually Pushing Up The US Number
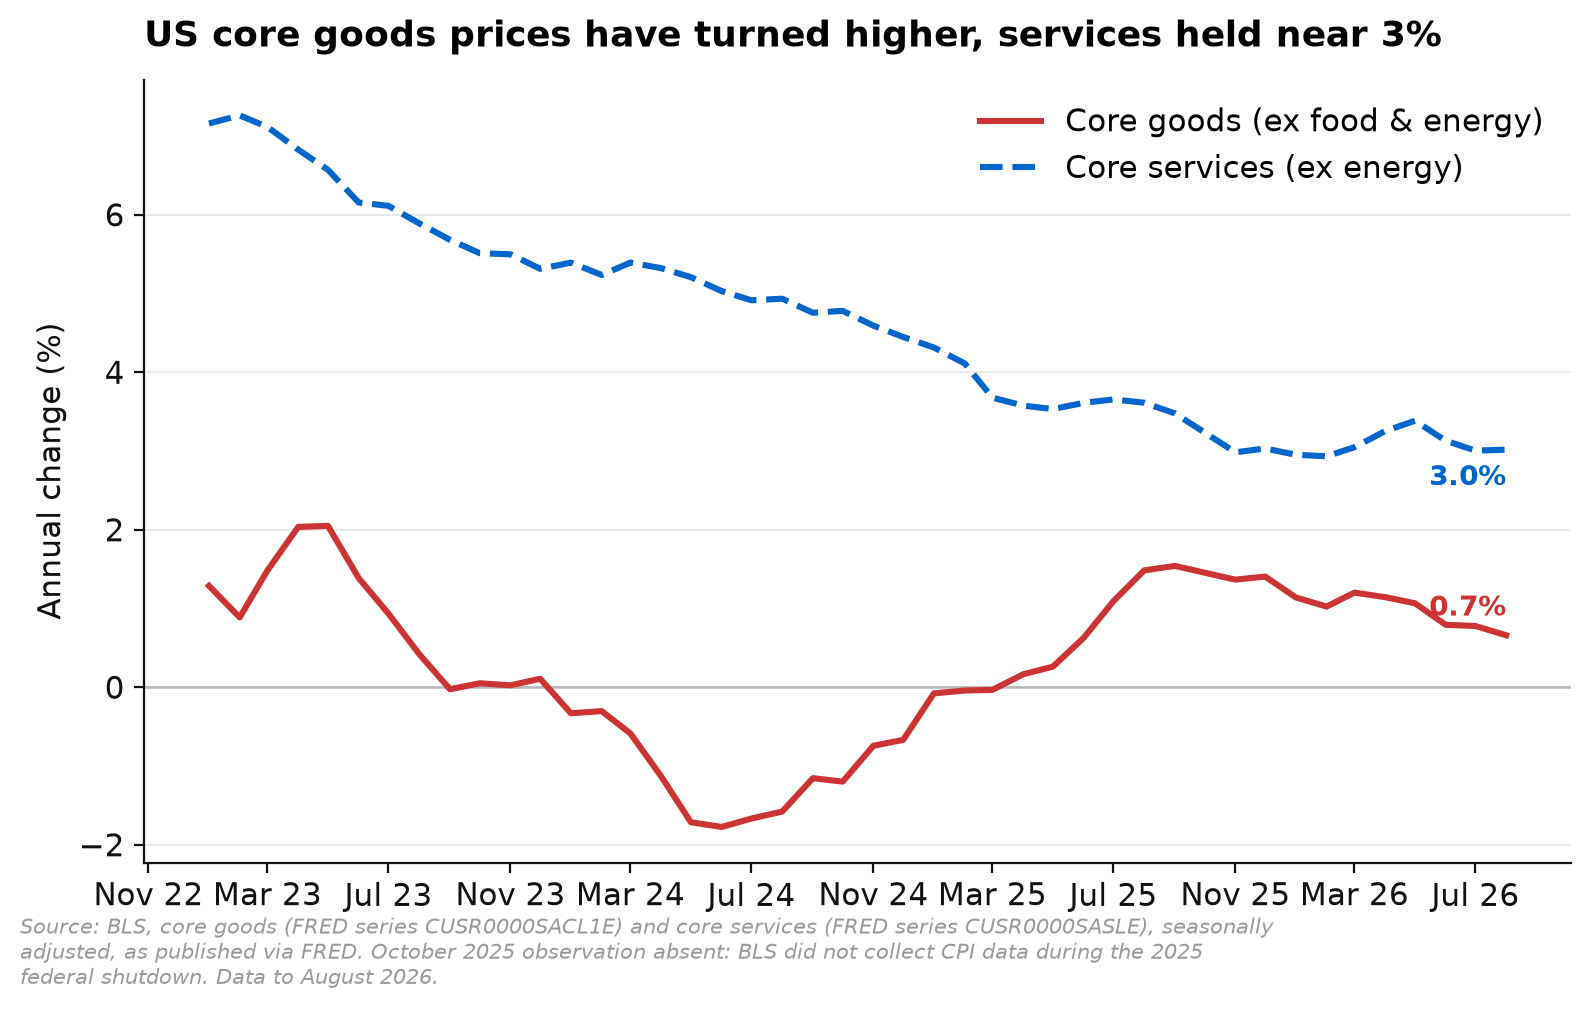
Core PCE at 3.0% looks like a standalone US problem, though we could not find a published goods-versus-services split of that specific PCE measure on BEA’s standard tables; the cleanest public goods-versus-services split sits in the CPI components, used here as a proxy. On that basis, core services inflation, the slice that tracks wages and rents, has eased from 3.6% a year ago to 3.0% in August. Core goods inflation cooled from pandemic-era highs to near zero by late 2023, turned negative in January 2024 and stayed in outright deflation through the year, then turned positive again in April 2025, peaked at 1.5% in September 2025, and has since eased to 0.7% in August 2026.
The level matters less than the direction implied by the research’s own framework. Because productivity growth is typically faster in goods than in services, a central bank’s target is usually consistent with goods inflation sitting below it and services inflation sitting somewhat above it. On that basis, US core goods inflation counts as an overshoot even while easing from its own peak, which is why the research names the US, alongside Brazil and Australia, as the exceptions where goods rather than services account for the larger share of the overshoot. The initial turn from deflation to a positive reading lines up with the escalation in US tariffs on imported goods through 2025. Institutional sell-side research has also flagged a more technical wrinkle sitting inside the PCE measure specifically, separate from the CPI figures above: the category covering software and computer accessories carries an unusually large weight in that index, is not adjusted for quality improvement, and has picked up a sharp run-up in memory chip prices tied to AI hardware demand. On that research’s own estimate, this single category is adding roughly a full percentage point to annual core goods inflation in the PCE measure, an effect it expects to fade through 2027 as memory prices stabilise and the weighting is revised.
Both of those drivers share a common feature. They are a cost shock sitting on top of the price level, not evidence that American households and businesses are bidding prices up because demand is running hot. That distinction is why the research treats the US overshoot as a less durable problem than the headline number suggests.
Why Services Are The Real Problem Everywhere Else
Flip the lens to the Euro area and the UK and the pattern reverses. Eurostat’s final August 2026 HICP release puts the bloc’s non-energy industrial goods inflation at 1.2%, against 3.0% for services. In the UK, CPI goods inflation sits at 2.7% against 3.4% for services. These are economies where the price pressure that remains is concentrated in the labour-intensive parts of the basket, rents, hospitality, insurance, the categories that move with wage growth and are slow to come back down once they are up. That is the textbook definition of sticky inflation, and it is a harder problem for a central bank to solve than a goods shock, because wage-price dynamics do not fade on their own the way a tariff pass-through or a commodity spike eventually does.
Canada’s reading is the mildest in this comparison. The Bank of Canada’s August 2026 release puts its three preferred core measures at 1.9% (trim), 2.0% (median) and 2.6% (common). Their 2.2% average is the lowest core reading in the sample, which keeps Canada out of the problem this piece is about, whichever half of the basket is doing the work there.
Put the US goods and services numbers next to this group and the US starts to look less like an outlier and more like a variant. Its services inflation is behaving like everyone else’s. Its goods inflation is not, for reasons that are largely policy-driven and plausibly temporary rather than structural.
Australia Is The Other Goods Economy
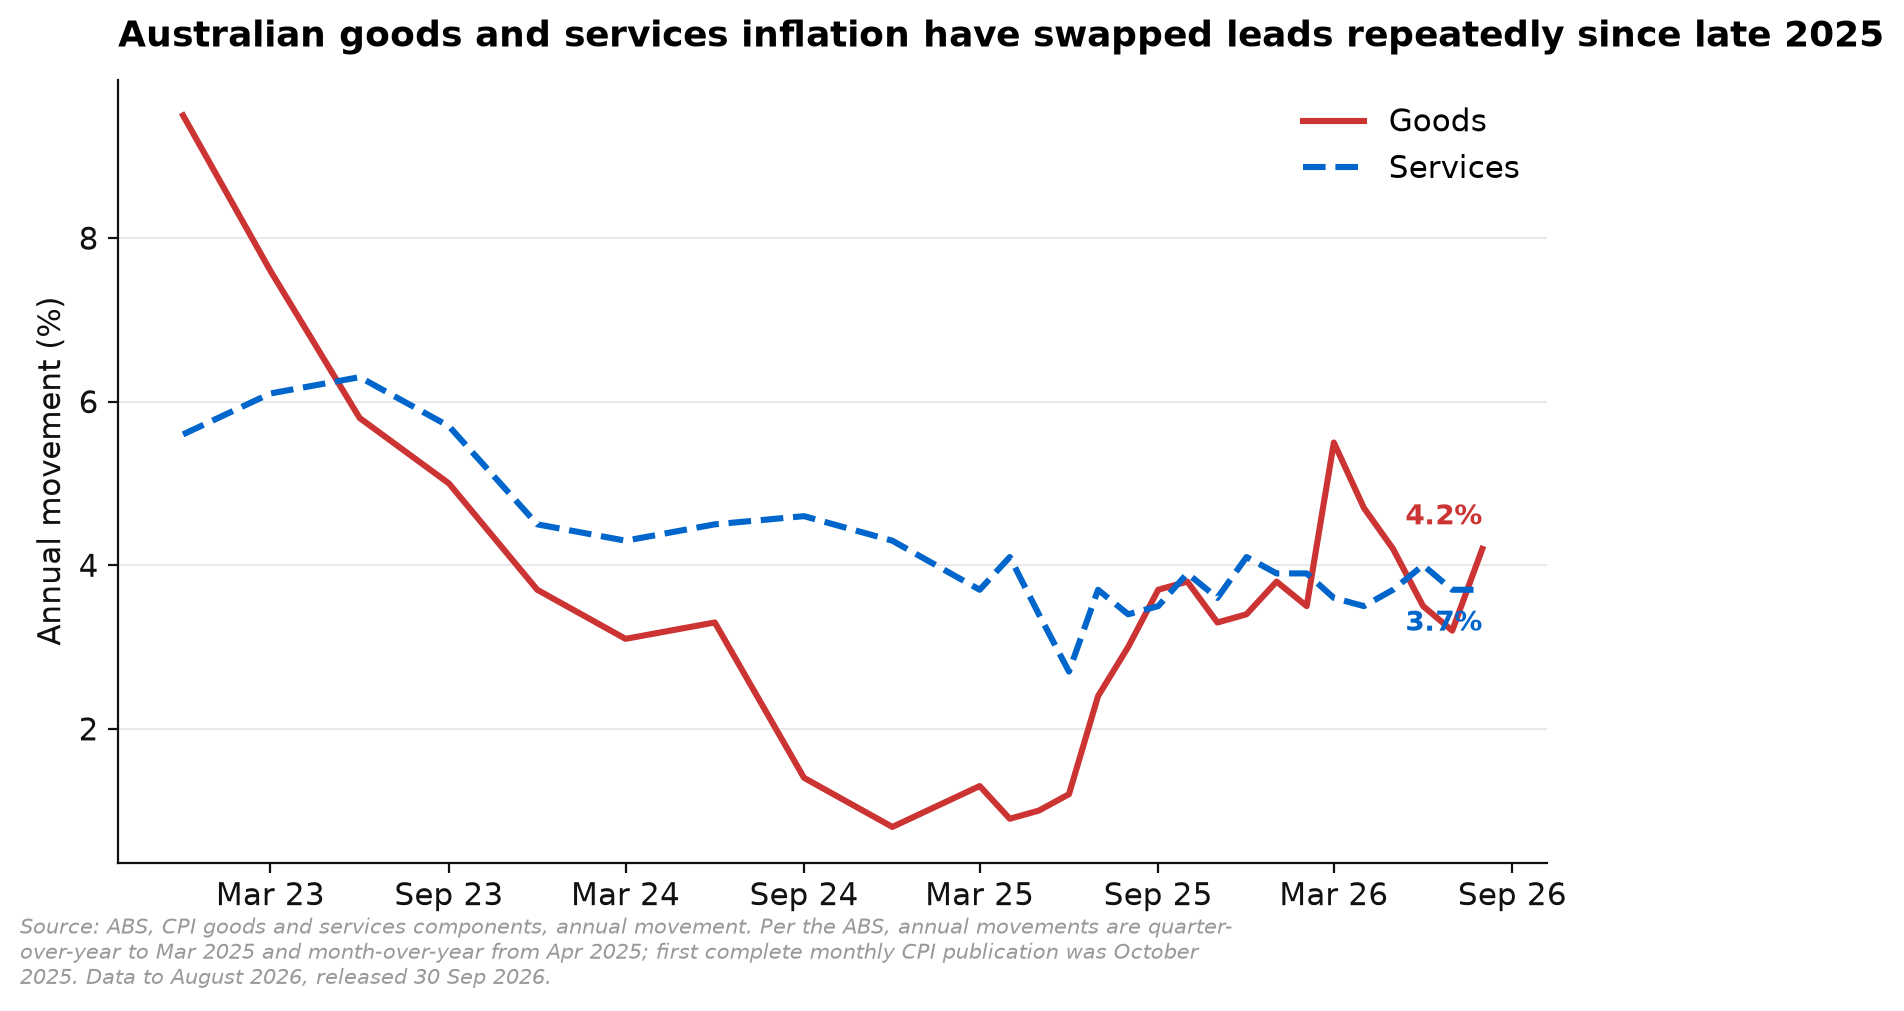
This is where the Australian data starts to rhyme with the US pattern rather than the European one, though the path has been less linear than a single clean crossover. ABS figures show headline CPI goods inflation at 4.2% in the 12 months to August 2026, against 3.7% for services, with goods running above services in five of the past twelve months rather than one uninterrupted stretch. Goods first moved above services in September 2025, slipped back below it from October 2025 to February 2026, moved above it again from March to May 2026, dipped back below services in June and July, then moved above it again in August as automotive fuel rose on higher global oil prices and the unwinding of the remaining federal fuel excise relief. The research’s own framework is the more useful lens on that volatility: goods inflation running close to, or above, services inflation is itself the overshoot signal, because a well-behaved goods basket should normally sit below a central bank’s target while services sits above it. Because the ABS does not publish a goods-versus-services split of the trimmed mean itself, this headline comparison supports the research’s framework rather than independently measuring the trimmed mean’s composition.
The ABS’s own component detail shows where the headline CPI pressure is actually coming from, and none of it looks like a wage-price spiral. New dwelling construction costs rose 5.4% in the year to August, as project home builders continue passing through higher labour and materials costs. Electricity costs rose 13.2%, largely because Commonwealth electricity rebates that were in place a year ago have since ended, a base effect rather than a genuine repricing of energy. Automotive fuel rose 13.5% in the year to August, up 14.8% in the month alone, driven by higher global oil prices and the unwinding of the remaining federal government fuel excise relief measures. These are large, specific movers inside the headline number. Over the same period the trimmed mean was 3.6% in both July and August, while the headline rate rose from 3.5% to 4.0%. None of it looks like broad, demand-led services inflation that would worry a central bank trying to judge whether the labour market is overheating. It is closer to the US pattern, a handful of specific, largely policy-related or import-linked cost pressures sitting inside an otherwise well-behaved basket.
There is a useful contrast with the US story here too. America’s goods overshoot is substantially an imported one, a function of tariffs raising the landed cost of goods bought from overseas. Australia’s is more of a local cost-push story, construction wages and materials, and an energy subsidy unwinding, rather than a tariff story. The mechanism is different but the shape of the problem, a goods-side shock sitting on top of a services backdrop that is behaving, is the same.
Australia’s services inflation, at 3.7%, is in fact lower than it was for most of 2023 and 2024, when it ran as high as 6.3%. The disinflation story in services has been working here too. It is the goods side of the ledger that has gone the other way.
What It Means For Local Markets
For an Australian investor, the practical read-through is less about the headline CPI number and more about what sits underneath it. A 3.6% core print driven by wage-sensitive services would be a genuine problem, the kind that tends to require sustained restrictive policy to dislodge because it reflects a labour market running hot. The ABS component detail above points elsewhere, with the largest annual movers in housing costs, energy and fuel rather than wage-sensitive services. The electricity effect in particular should drop out of the annual headline CPI comparison within twelve months once the rebate’s removal is fully lapped, which will pull the headline number down mechanically even if nothing else changes.
That composition matters for how markets should read every RBA commentary between now and early 2027. A central bank facing a services-driven overshoot has to lean on demand, which means higher rates for longer. A central bank facing a goods and administered-price overshoot has more room to look through it, provided services inflation stays contained, which the data above suggests it currently is. None of this is a prediction about what the Reserve Bank will actually do with the cash rate. It is a read on which of the two inflation problems Australia is more exposed to, and on the public data, it looks like the more temporary one.
It also points to where the pressure sits at a sector level. Businesses with heavy exposure to global input costs, importers, retailers sourcing offshore, residential builders buying imported materials, are the ones most exposed to the goods-side part of this story and are the ones to watch for further cost pass-through. Businesses whose cost base is mostly local wages, which is most of the services economy, are not showing the same strain: services inflation at 3.7% remains well below the 6.3% peak it reached in 2023, consistent with cooling rather than re-acceleration.
The other takeaway is for anyone benchmarking Australian conditions against US headlines. The commentary that the US has an inflation problem the rest of the world does not is only half right. The US and Australia currently share the same problem, a goods-side overshoot sitting on top of a services backdrop that is behaving. Investors positioning portfolios around a view that Australian inflation is structurally different from the US experience should check which half of the basket is actually doing the work before leaning on that view.
What Would Change This Picture
Three things would tell us whether this goods-side story is genuinely temporary. The first is the electricity base effect, which is close to mechanical and should fade from the annual comparison as the rebate’s removal a year ago cycles out of the calculation. The second is whether new dwelling construction costs keep rising at the current pace or start to ease as builder order books normalise. The third, specific to the US side of this comparison, is whether the memory chip and software measurement effect inside core PCE actually fades through 2027 as sell-side research currently expects, and whether the index-weighting revision that same research expected with the August 2026 PCE data, released 30 September 2026, was in fact implemented and reduces that category’s contribution in the months ahead.
None of those three is a broad, demand-led services wage story, though new dwelling construction costs do carry a labour-cost component of their own, distinct from an economy-wide wage-price spiral. If all three play out as expected, the goods overshoot in both Australia and the US should fade without needing a change in the labour market to do it, which is the more benign of the two ways core inflation gets back to target. The one thing that would change the read is any sign of services inflation reaccelerating alongside the goods story, in either country, because that would be the signal that the problem has stopped being temporary and started being broad.
Interested in how we can help? Get in touch with our team or call us on 1300 889 603.